Several key metrics are used to monitor a solar asset's performance. The Renewables Suite platform utilizes these to help users identify which assets are performing well and which require additional attention to increase overall plant health to help get the best return on investment.
The Performance Ratio is used for gauging solar plant performance over time and comparing the performance across multiple assets in a fleet.
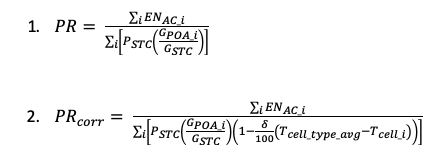
Where:
ENAC_i : Measured inverter AC power (kW)
PSTC : Summation of installed modules power rating from module data sheet (kW)
GPOA : Measured plane of array(POA) irradiance (kW/m2)
GSTC : Irradiance at standard test conditions(STC) (1,000 W/m2)
Tcell : Cell temperature computed from meteorological data (C)
Tcell_typ_avg : average cell temperature computed from one year of weather data using the project weather file (C)
delta : Temperature coefficient for power(%/C, negative in sign) that corresponds to the installed modules
Renewables Suite uses four different calculation methods based on the two equations below. These help users identify performance trends at their solar plants and identify what may be causing the shortfalls by comparing the calculation methods.
Performance Ratio
This is the basic performance ratio calculation using equation 1 above. This compares an inverters AC power output to an Expected DC field power adjusted for observed irradiance.
Weather Corrected Performance Ratio
This performance ratio calculation referrers to equation 2 above and simply takes equation 1, but also adjusts expected DC field power for the observed temperature compared to STC conditions. Adjusting for temperature helps to create a more useable performance metric by making the value more consistent throughout the year.
Performance Ratio (Filtered)
This filtered calculation uses the Performance Ratio calculation but filters out time periods with curtailments or downtimes. This helps to get a better picture of plant performance during times of uninterrupted production.
Weather Corrected Performance Ratio (Filtered)
This filtered calculation uses the Weather Corrected Performance Ratio calculation but filters out time periods with curtailments or downtimes. This helps to get a better picture of plant performance during times of uninterrupted production.
When evaluating the overall performance of a solar plant, DC losses are an important factor to consider as these can add up to significant losses over time. DC losses refer to a percentage of loss to the DC field of a solar plant caused by soiling, tracker misalignment, advanced panel degradation, broken panels, open connections, and bad fuses. DC losses can be estimated utilizing DC input currents into the inverter.
DC Current Measurements
DC losses can be measured using DC current readings at the inverter and comparing those to the expected DC current readings based on the build of the DC field and observed irradiance. In order to calculate the DC losses from DC current readings, accurate drawings or information describing the site's DC build, inverters, and modules are needed.
By considering these design criteria the platform comes up with an expected current value. This is obtained by using the following data points to calculate the expected current value.
- Number of strings fed into current reading being analyzed
- Maximum power point current from data sheet
- Time series plan-of-array irradiance (POA)
After an expected current value is obtained other loss factors need to be accounted for that could skew the loss calculation such as:
- Module Degradation
- Curtailment or Outage events
Once those have been cleaned from the data the expected current value is then compared to the measured current value to determine the estimated DC losses in the array or site for a specific time period. Maintaining a DC Loss history of the site helps users to track trends in performance and signal reasons for investigations in the field to look for issues causing shortfalls.
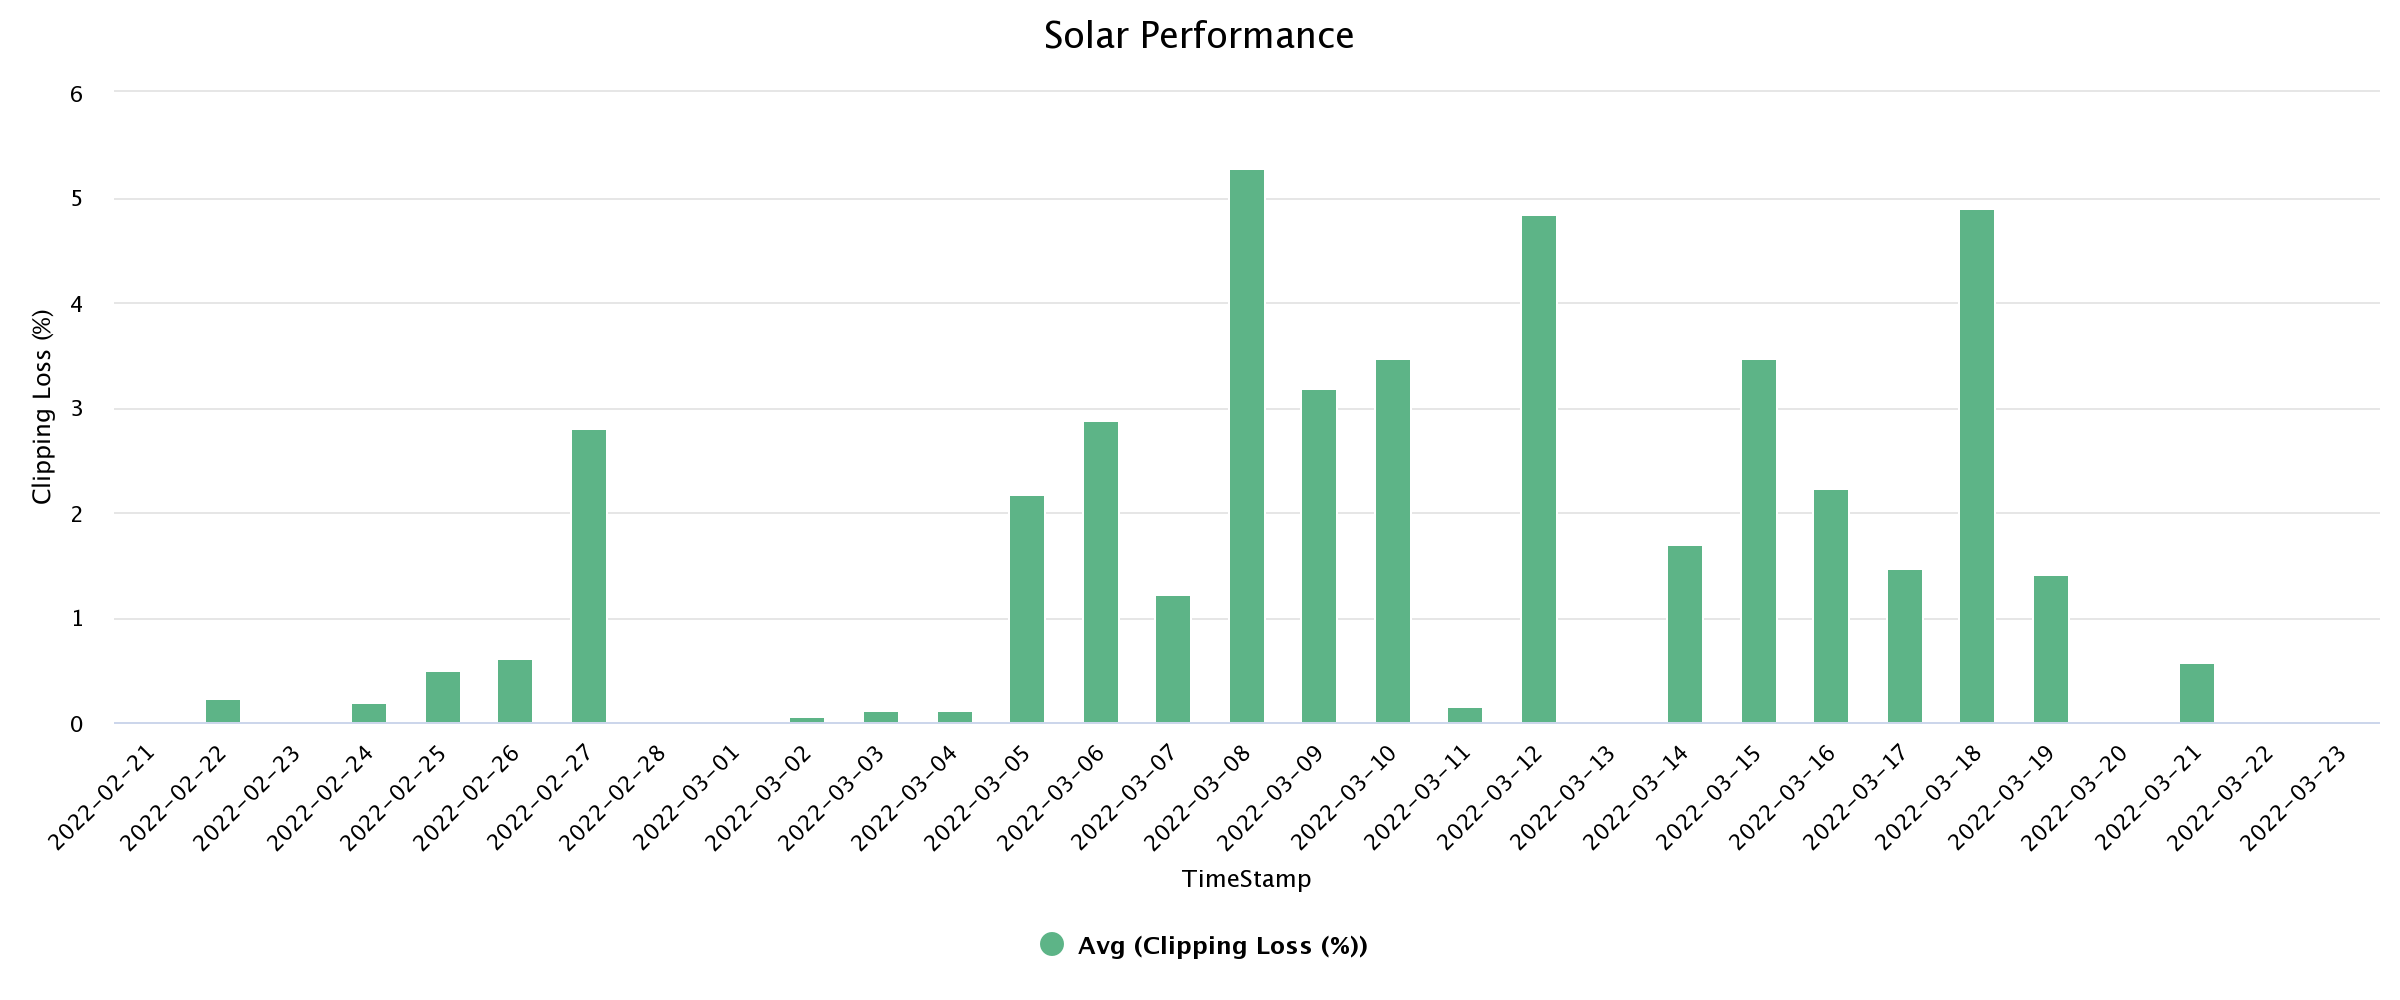
Clipping Loss Percentage is a useful metric for users to utilize to determine the percent of energy lost due to clipping at the solar inverters. Clipping loss refers to energy lost due to the inverter derating its output to meet either its maximum power rating or the maximum allowable power at the grid connection. This inverter power clipping occurs due to solar sites having a higher DC capacity than AC output ability. Clipping can also be seasonal as irradiance levels may be low enough in the winter where clipping isn't present on a clear sky day.
Generally solar sites are designed to have a higher than 1 to 1 DC to AC ratio. By adding more panels to achieve a higher DC capacity than AC output requirements, it allows the site to have more production over the operating lifetime of the asset by helping to neutralize the degradation of the panels over time. This is a cost benefit analysis that Developers and Engineers have to balance when designing the site.
This metric is valuable for users looking to do a cost benefit analysis for potentially shifting some of the energy lost due to clipping to DC coupled energy storage. It can also be helpful for determining the
Clipping Loss Percentage is calculated using the following steps:
- Projected Performance Ratio: This is calculated by looking at the PR prior to clipping and after
- Simulated Energy: Utilizing the Projected PR, Irradiance, and site specific metrics a Simulated Energy is calculated
- Clipping Loss: Identified by taking the Simulated Energy and subtracting the actual energy production.
- Clipping Loss Percentage: The percentage is calculated by taking the Clipping Loss Energy divided by the actual energy production for that day.
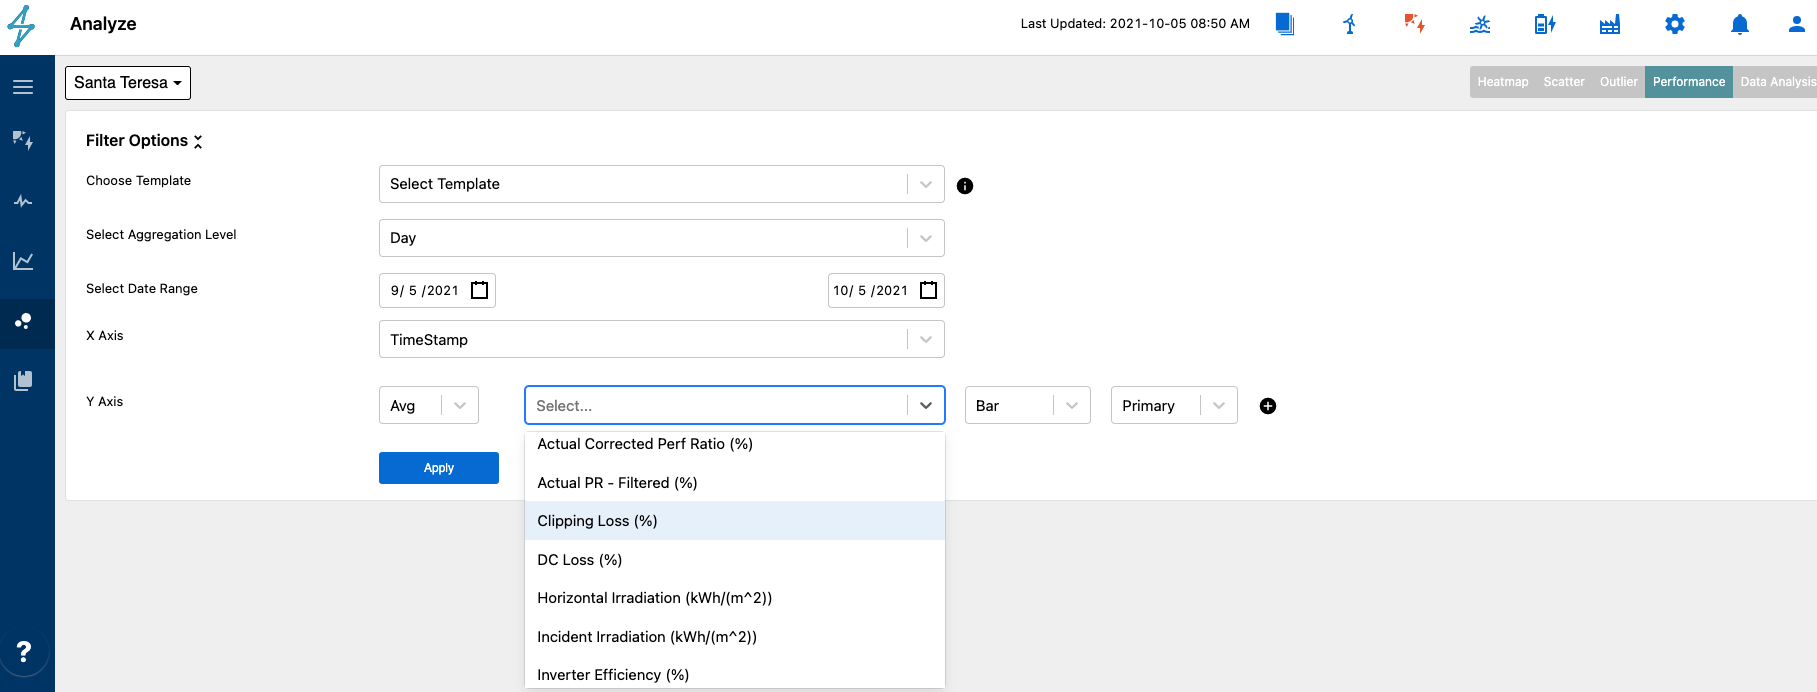
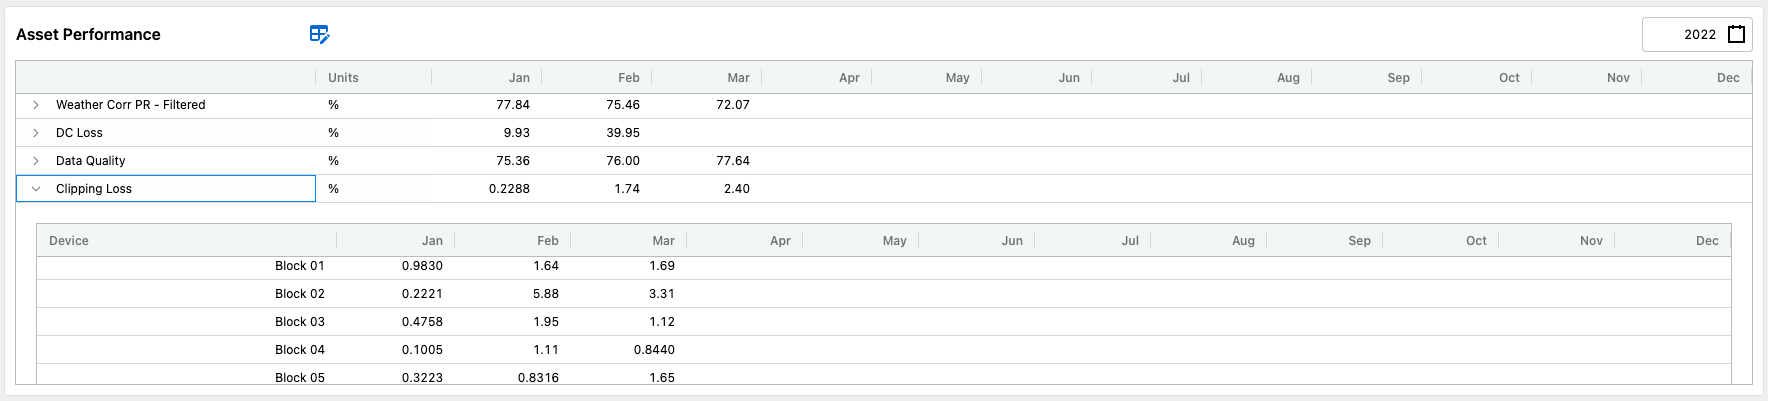
Clipping Loss Percentage can be found in the SparkCognition Renewables Suite on the Performance Tab and Data Analysis Tab of the Visualization Module.
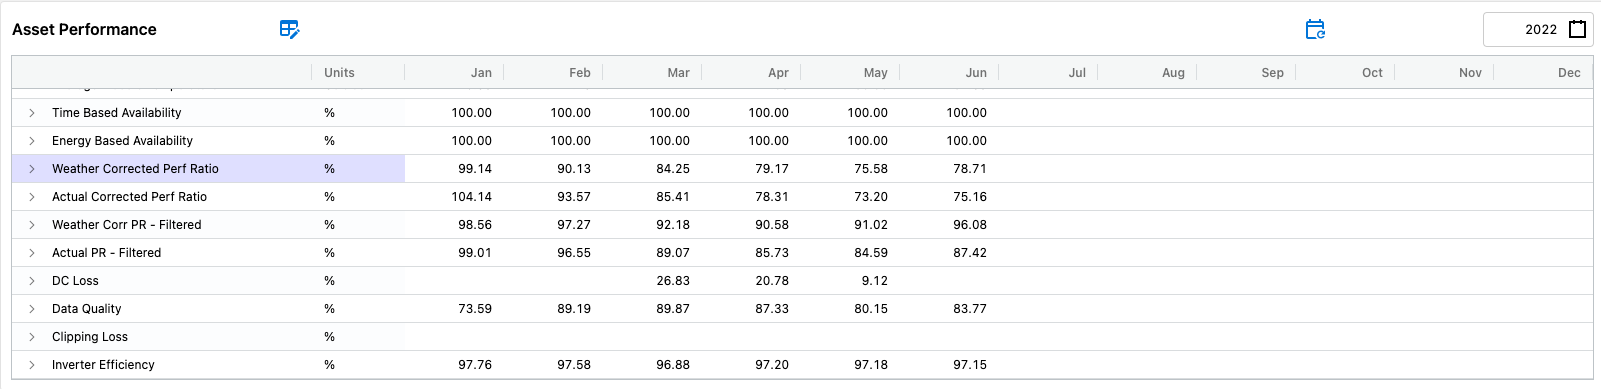
It can also be found in the in the Asset Performance Table on the Asset Overview Page.
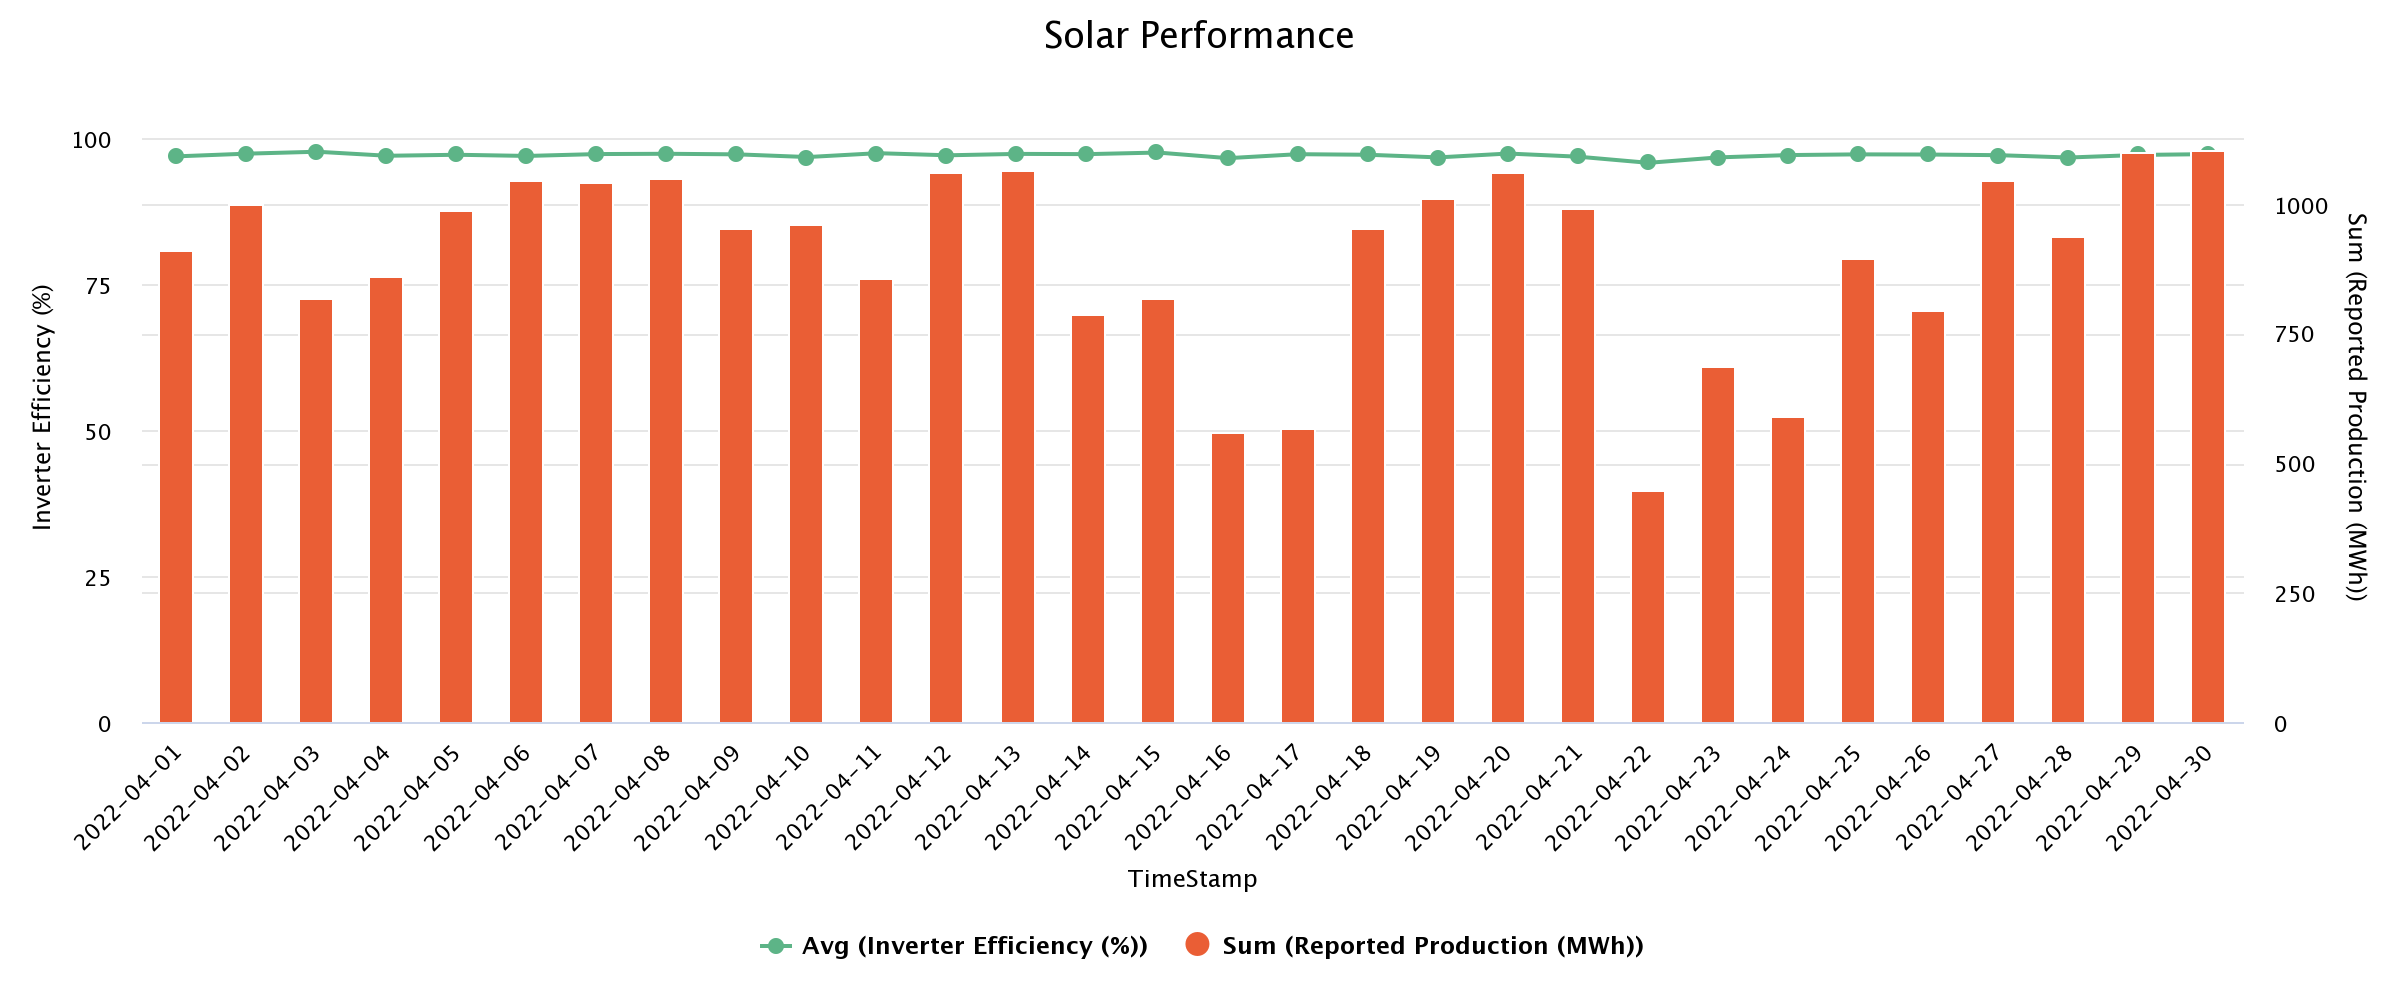
Inverter Efficiency is an important metric to monitor over time as it can be an indicator of poor inverter health. Most inverters have an efficiency data point that they report, but if one is not present calculating it is easy.
Inverter Efficiency = Pac/Pdc
Where Pac = Inverter AC output power AND Pdc = Inverter DC input power
This metric can be found in the Visualization Module on the Performance Tab and Data Analysis Tab.
It can also be found in the Asset Performance Table on the Asset Overview Page