The Asset Performance Table widget allows users to get a quick overview of the project for the selected year to date. The Asset Performance table includes all major KPI's such as Actual vs. Budgeted Energy Production, Weather Conditions, Capacity Factor, Performance Ratio and Availability Information etc.
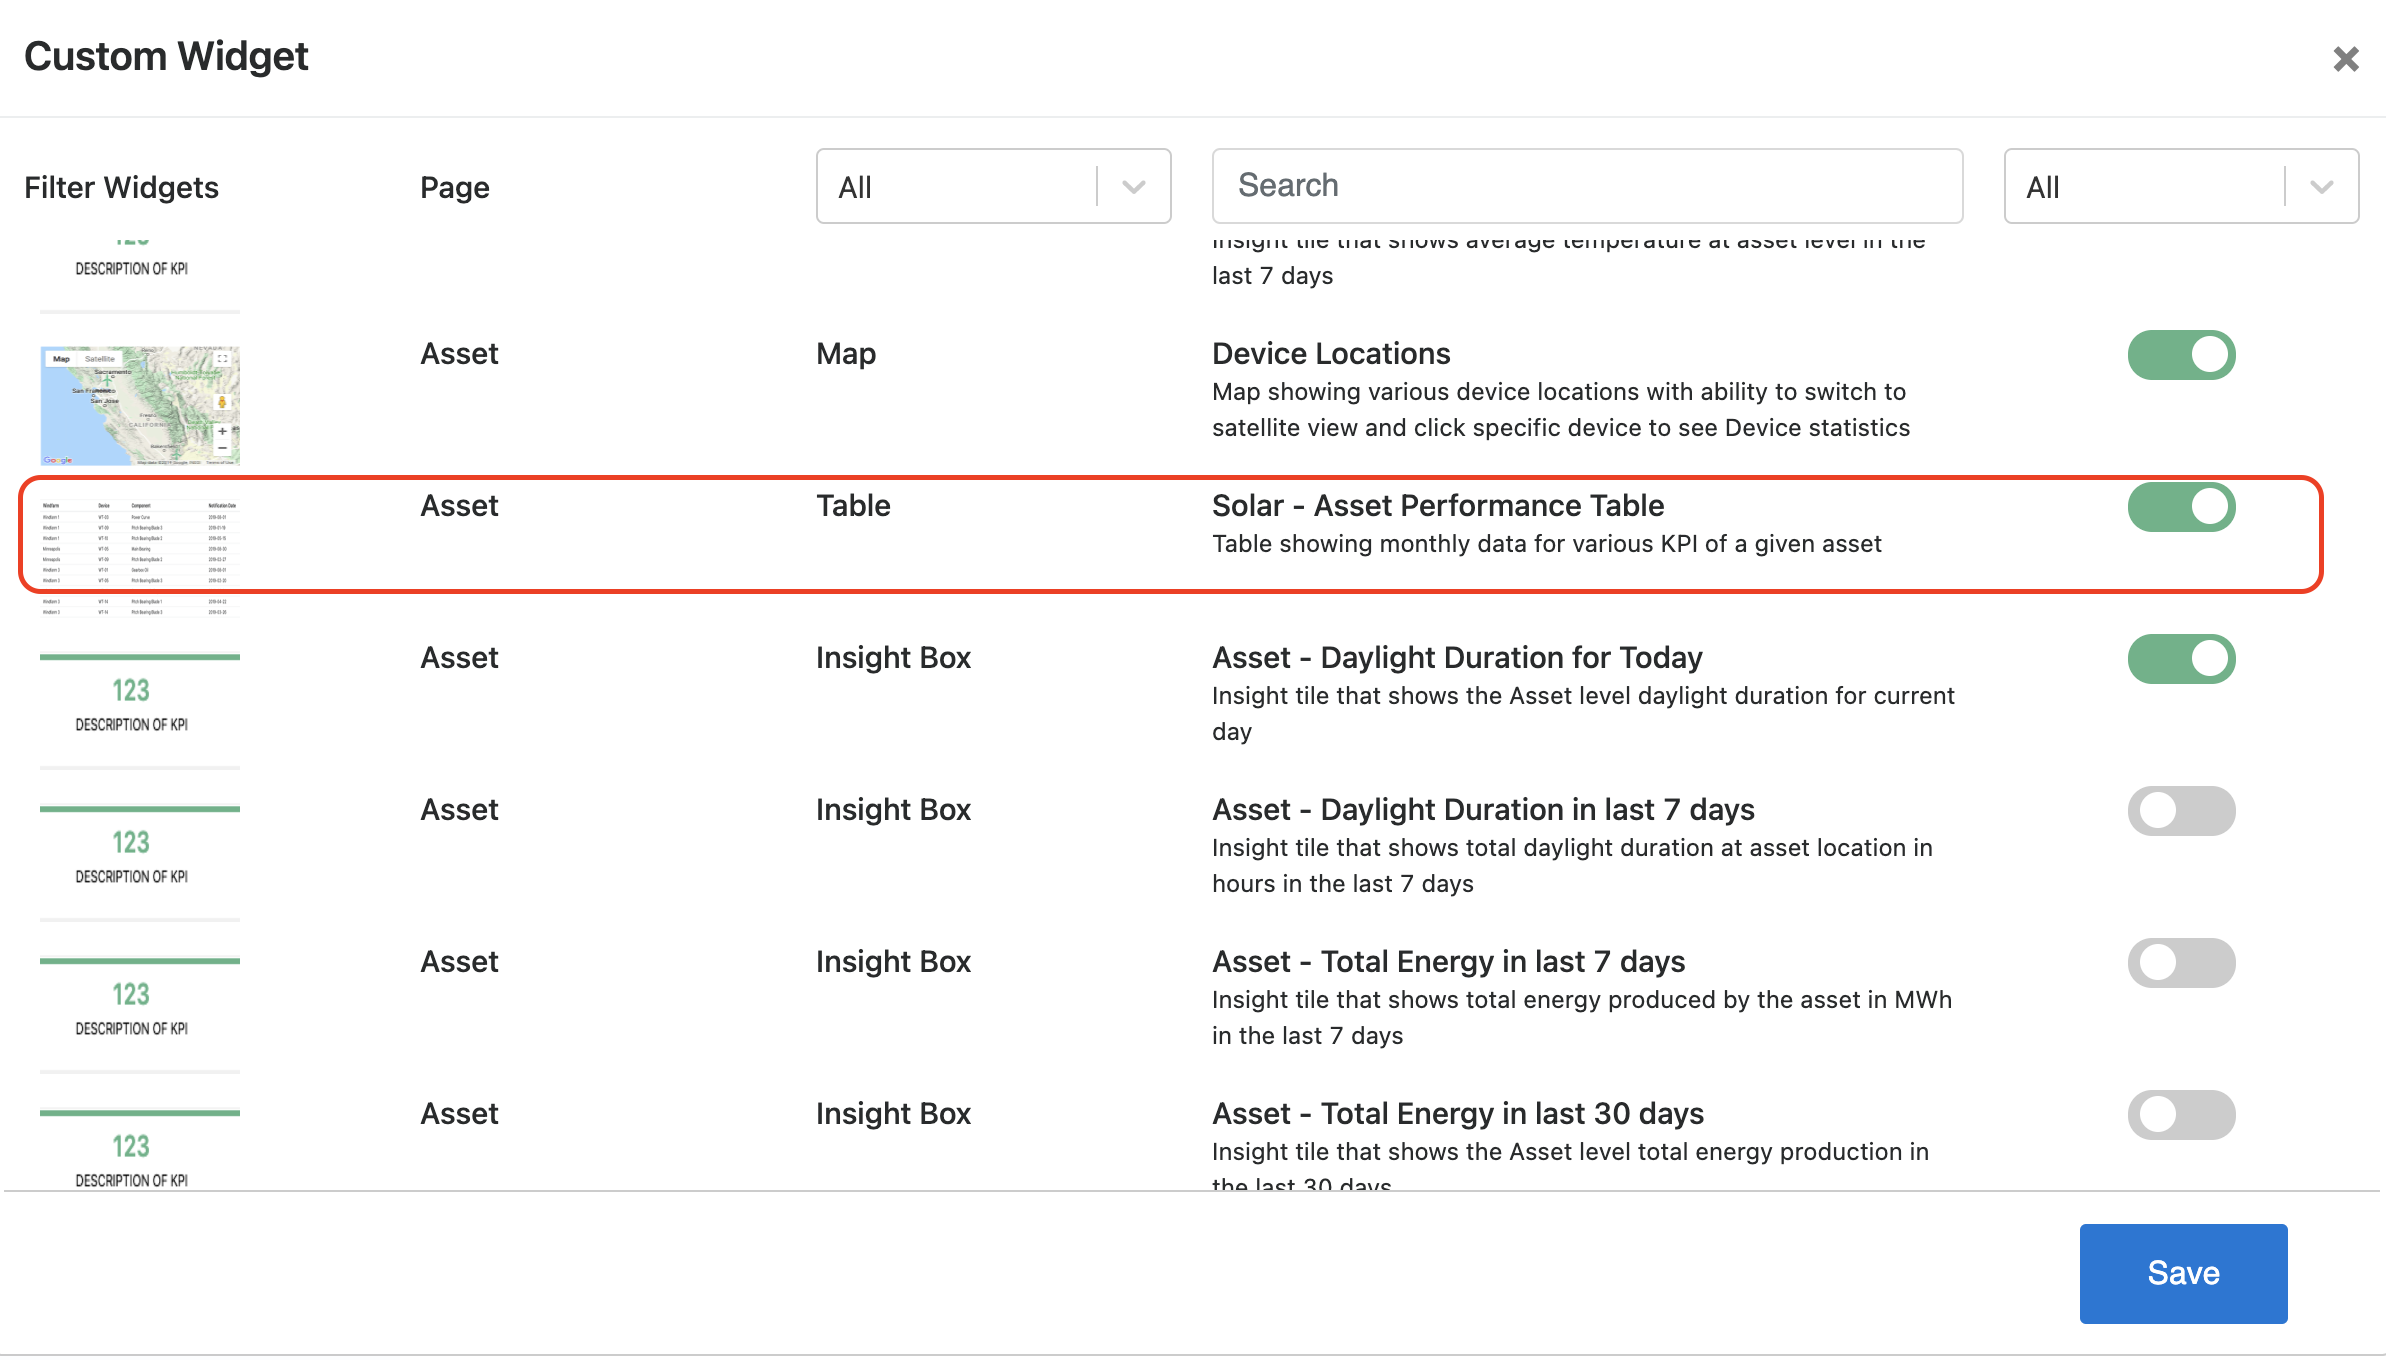
The Asset Performance Table, if not already present on the Asset Tab, can be added through the customizable widgets process described in the section above.
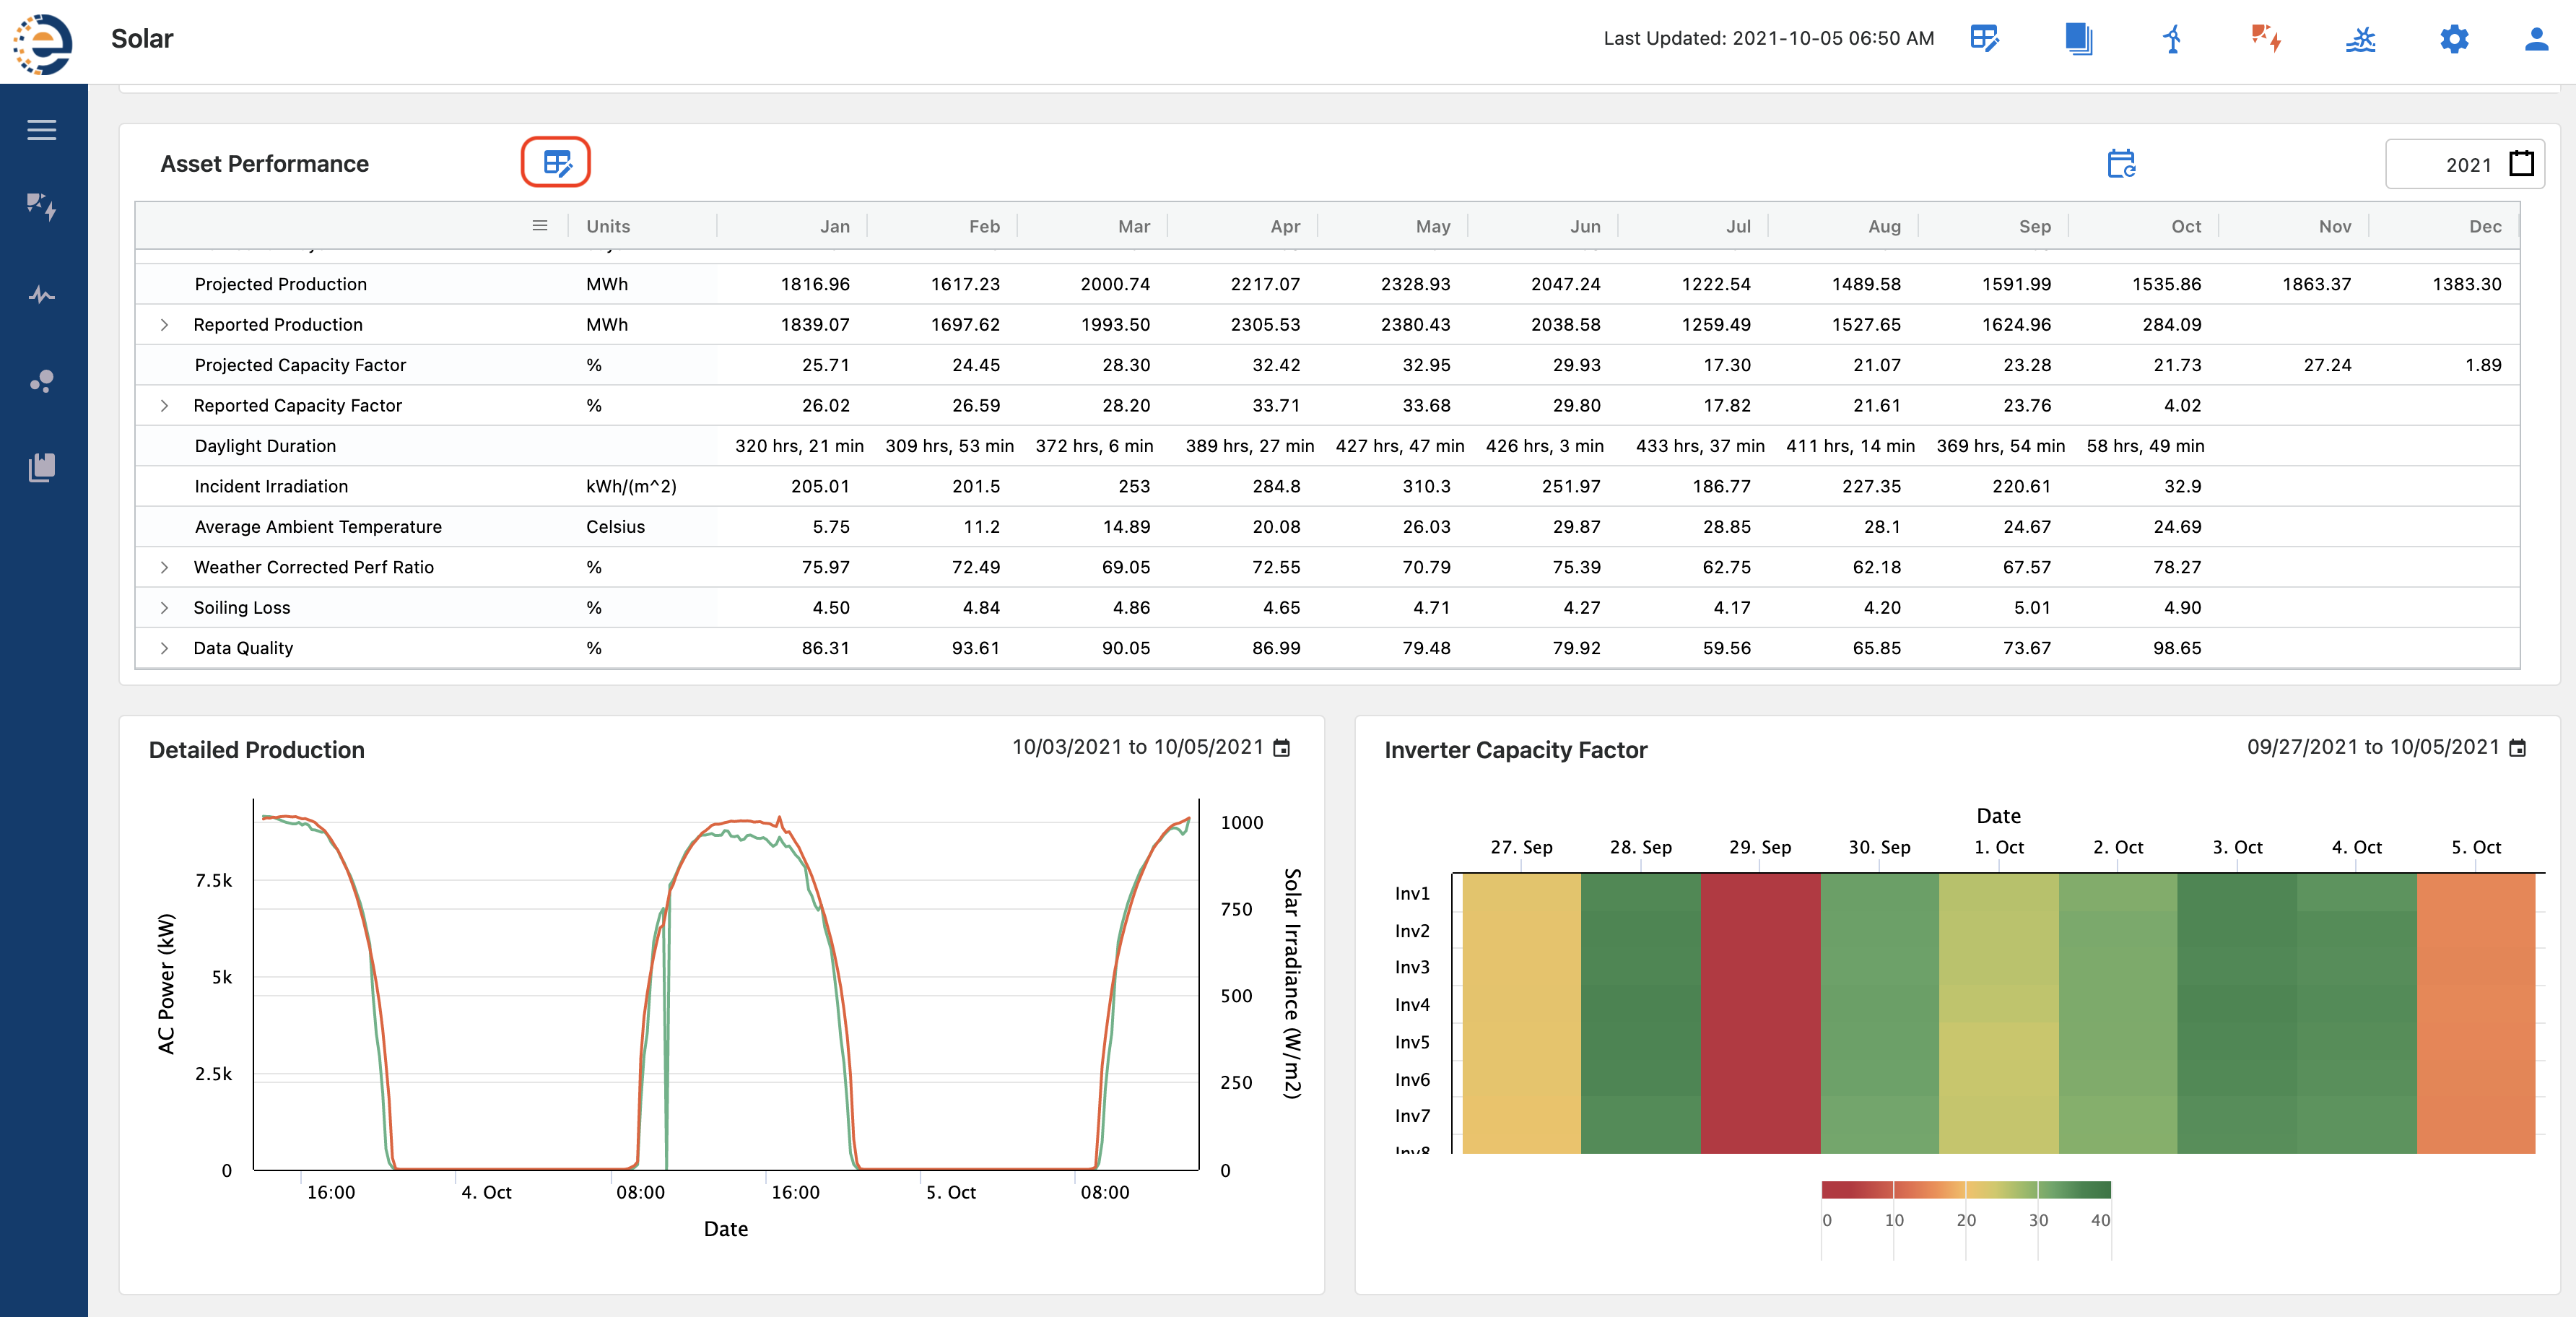
The Asset Performance widget is comprised of over 35 KPI's from various categories such as Performance, Ratio and Soiling Analysis, Availability Reporting etc.
To customize the Asset Performance table click the Edit Icon on top of the table. The edit window opens a popup where users can be re-organize the fields in desired order of display by dragging and reordering the fields.
To customize the field name e.g. to change display name of Grid Curtailment to Utility Curtailment simply double click the Custom Field Name cell and enter the desired field name. To show or hide a particular KPI from the UI check or uncheck the Display column. Once done editing click Save and close the popup. This will result in reloading of the table and all changes would be effective immediately.
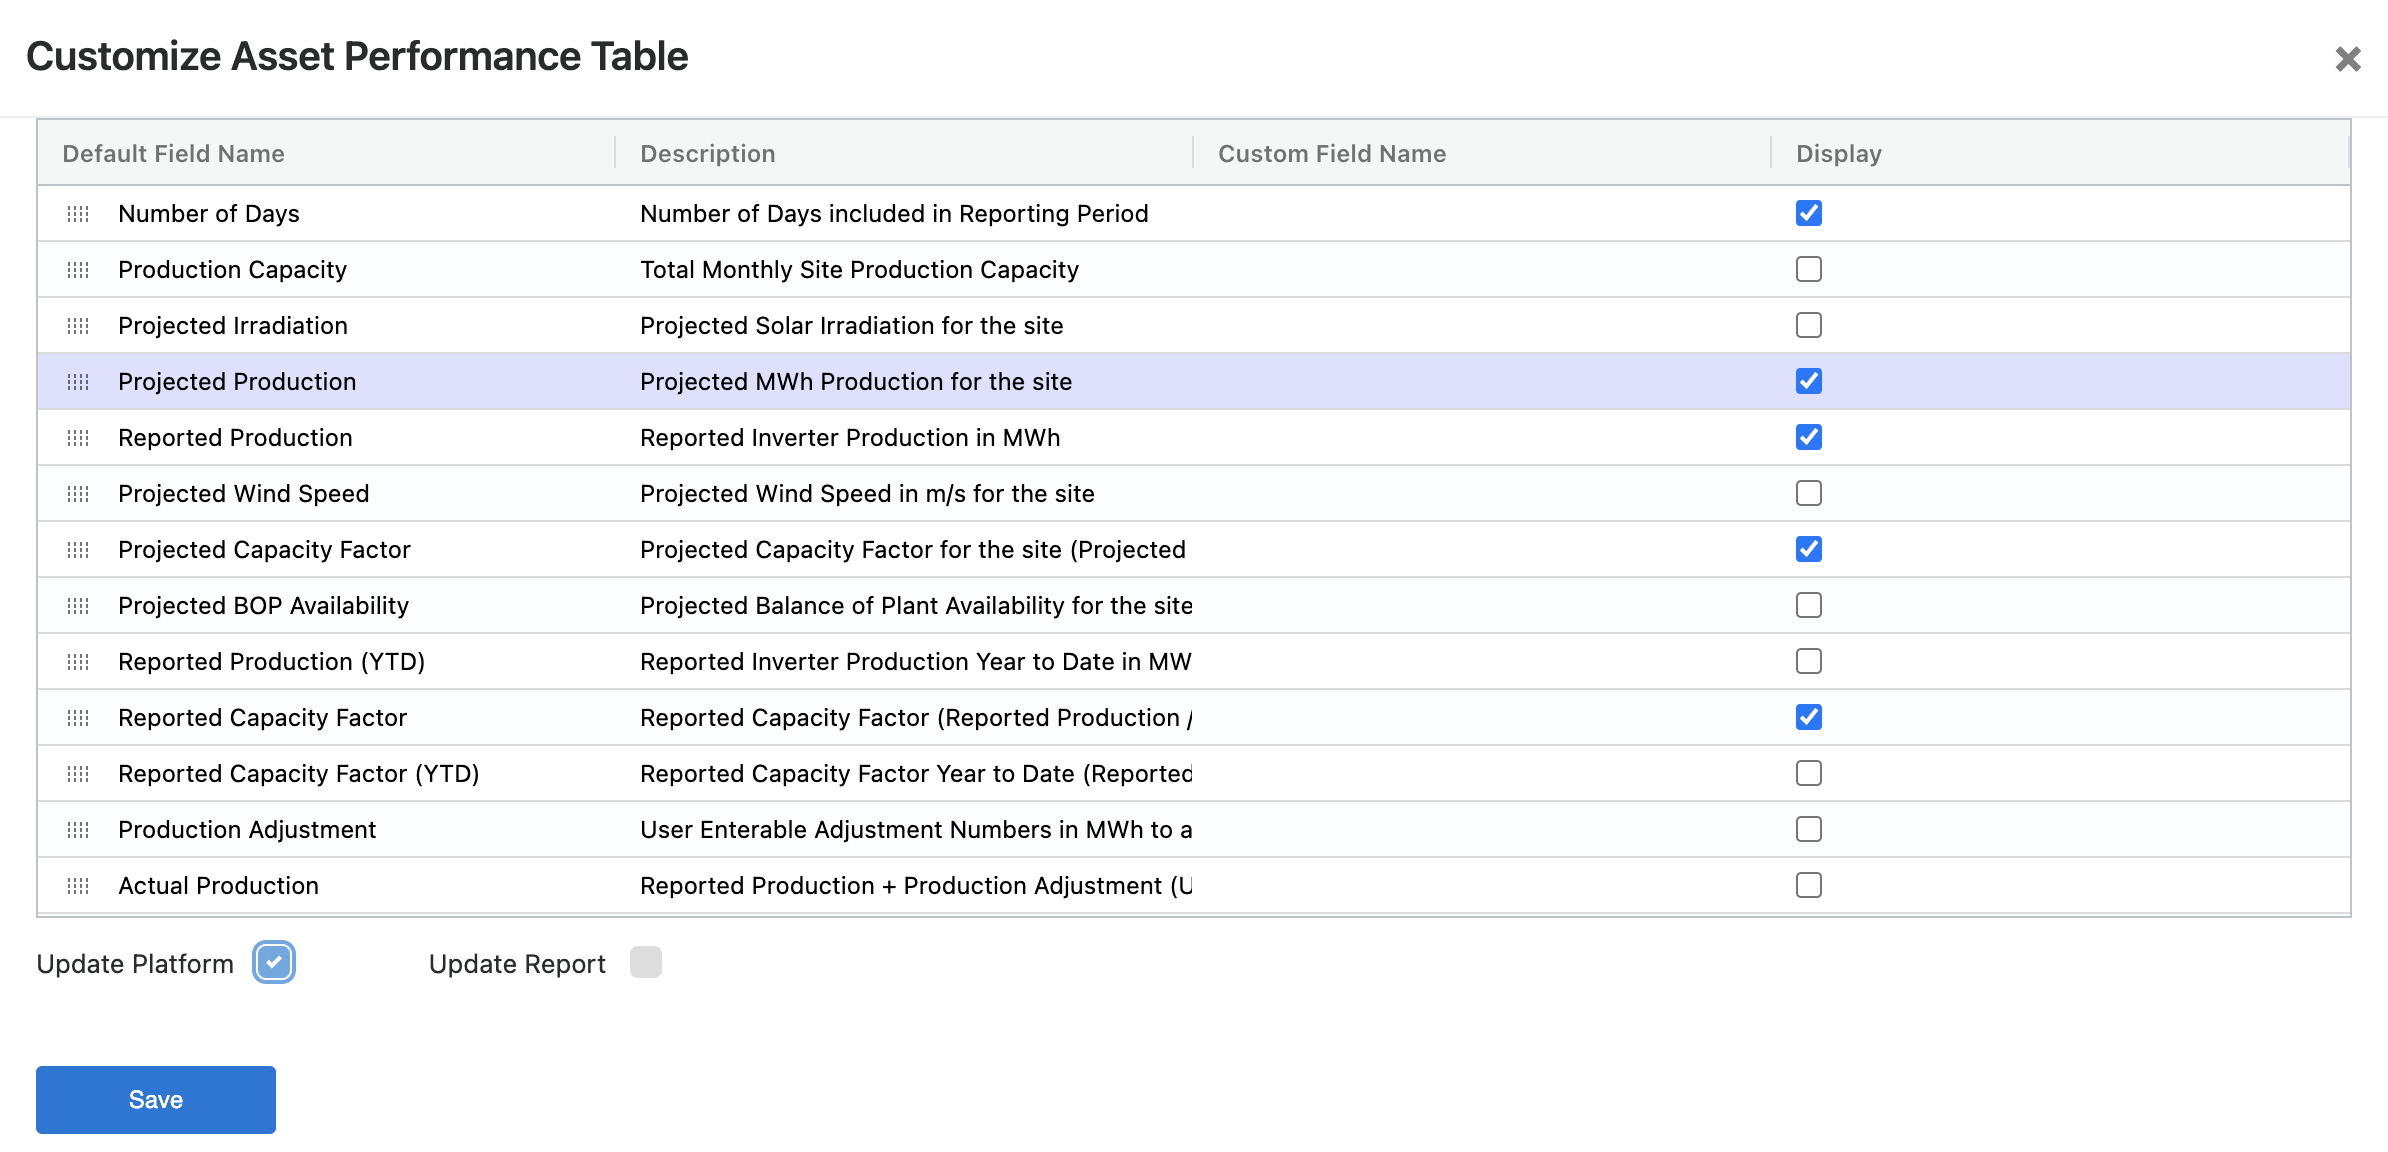
Users have two options to select from prior to saving.
- Update Platform
- Update Report
Update Platform updates the Asset Performance table and not the Asset Performance table in reports. Selecting Update Report brings up the metrics currently displayed in the report and allows users to update those without changing the Asset Performance Table view on the platform.
🚧
Asset Performance Table Customizations
Any changes made to Customize Asset Performance table are visible to all users across the Asset. Every user at the asset will see any display name or table organization changes. If you are unsure of the settings and need help then reach out to SparkCognition Support team for help with table customization.
Below is a listing of all fields users can select to have in the Asset Performance Table either on the platform or in a report.
General
Number Of Days : Number of Days included in Reporting Period
Weather
Projected Irradiation : Projected Irradiation for the site
Horizontal Irradiation : Irradiation measured on a horizontal plane at the site during the reporting period
Incident Irradiation : Irradiation measured as seen from the plane of the array for the site during the reporting period
Projected Wind Speed : Projected Wind Speed in m/s for the site
Average Wind Speed : Average Wind Speed for the site during the reporting period
Average Ambient Temperature : Average Ambient Temperature for the reporting period
Average Module Temperature : Average Module Temperature for the reporting period
Daylight Duration : Total Daylight duration for the site during the reporting period
Production
Production Capacity : Total Monthly Site Production Capacity
Projected Production : Projected MWh Production for the site
Reported Production : Reported Inverter Production in MWh. Calculated as SUM(Active Power 10min kW)/6000 to get the value in MWh.
Reported Production (YTD) : Reported Inverter Production Year to Date in MWh
Production Adjustment :Adjustment Numbers in MWh to account for Data and Line Loss etc. Automatically calculated based on Site Meter or user enterable field if meter information is unavailable.
Actual Production :Reported Production + Production Adjustment (Use negative adjustment to reduce)
Actual Production (YTD) :Reported Production Year to Date + Production Adjustment Year to Date
Gross Production :Adjusted Production + Total Curtailment where Total Curtailment includes Grid, Environmental and other curtailments. If the curtailment module is disabled then these values are not auto calculated.
Gross Production (YTD) :Adjusted Production YTD + Total Curtailment Year to Date
Curtailment
Grid Curtailment :MWh Loss due to Grid Curtailment
Environmental Curtailment :MWh Loss due to Environmental Curtailment
Other Curtailment :MWh Loss due to Other Curtailment
Total Curtailment :Grid + Environmental + Other Curtailment
Total Curtailment Percentage :Total Curtailment / Gross Production
Capacity Factor
Projected Capacity Factor : Projected Capacity Factor for the site (Projected Production / Production Capacity)
Reported Capacity Factor : Reported Capacity Factor (Reported Production / Production Capacity) Percentage
Reported Capacity Factor (YTD) : Reported Capacity Factor Year to Date (Reported Production / Production Capacity) Percentage
Actual Capacity Factor : Adjusted Production / Production Capacity Percentage
Actual Capacity Factor (YTD) : Adjusted Production / Production Capacity Percentage Year to Date
Gross Capacity Factor : Gross Production / Production Capacity Percentage
Gross Capacity Factor (YTD) : Gross Production / Production Capacity Percentage Year to Date
Availability
Projected BOP Availability : Projected BOP Availability for the site taken from yearly projections data for the site.
Time Based Availability :Percentage of Time when Devices were Available for Operations. This is calculated by taking excluding the Alarms marked with Available = FALSE (Unavailable) on Alarms module. Thus, if out of a 10 minute reporting period there was an unavailable alarm for 2 minutes then we will mark the TBA for that 10minute duration as 80%. The overall TBA number is an aggregation of TBA values at each 10 minute interval.
Energy Based Availability :Contractual Energy Based Availability Percentag based on the equation below :
Production based EBA (Contractual) =
(Reported Production)/(Reported Production + Energy Loss)
Data Quality : Percentage of 10 min data available during the reporting period
Performance Metrics
Actual Corrected Perf Ratio :Performance Ratio adjusted by actual irradiance compared to STC irradiance
Weather Corrected Perf Ratio :Performance Ratio adjusted by actual irradiance compared to STC irradiance and actual temperature compared to STC temperature
Actual PR (Filtered) : Performance Ratio adjusted by actual irradiance compared to STC irradiance with downtimes and lost production periods filtered out
Weather Corr PR (Filtered) :Performance Ratio adjusted by actual irradiance compared to STC irradiance and actual temperature compared to STC temperature with downtimes and lost production periods filtered out
Soiling Loss : Soiling Loss Percentage calculated by DC current values versus forcasted current readings