The Renewables Suite Platform enables users to define report templates using widgets available for plotting on the platform. In addition to defining templates users can also create report schedules for reports to be automatically generated on a daily, weekly or monthly basis and also automatically distributed to a pre-selected list of users via email.
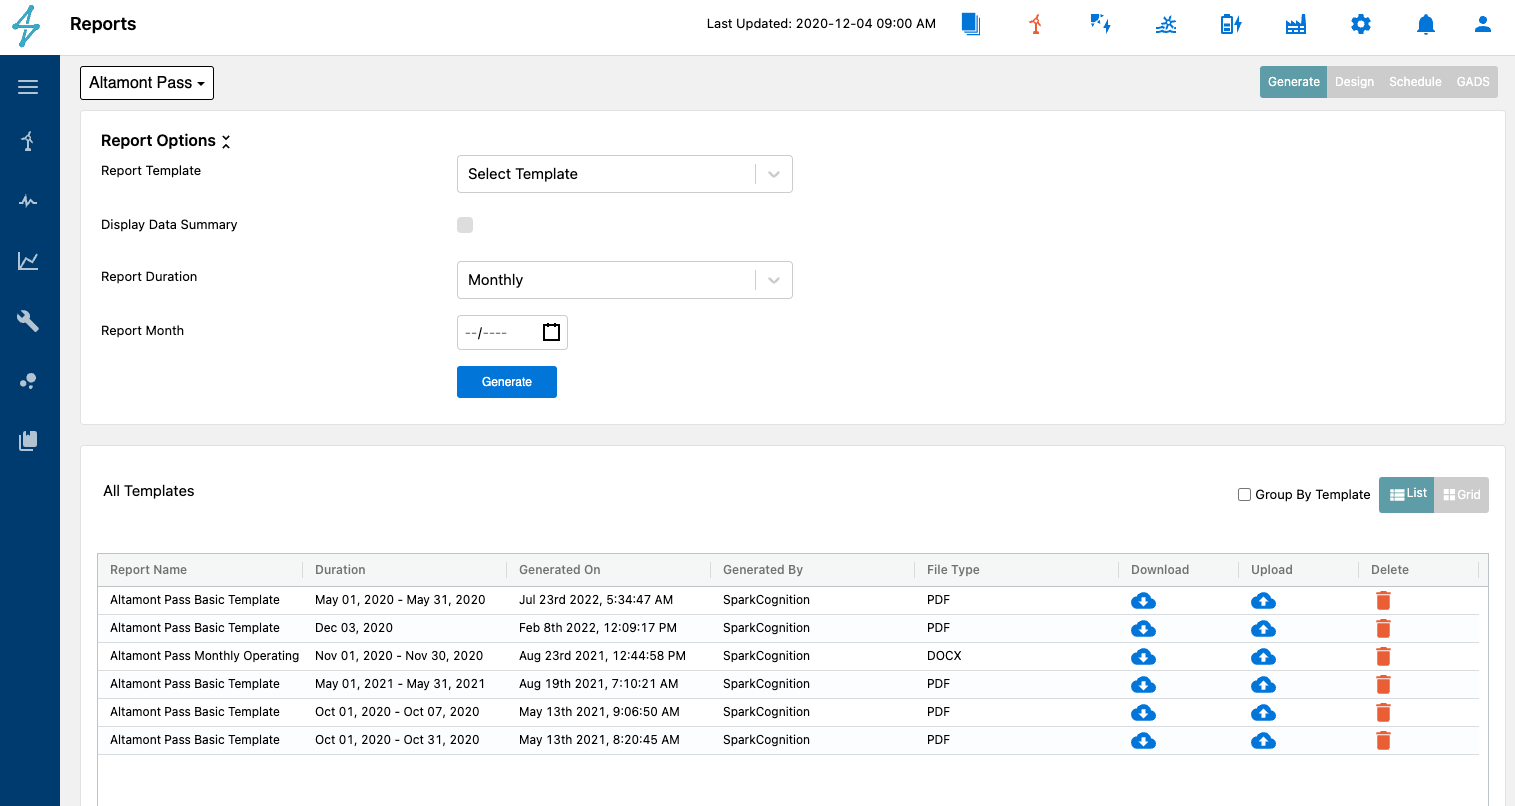
Using the Generate tab on Reports module users can generate reports for a selected duration using any already created template. The report template drop down allows you to search for existing report templates. The Display Data Summary checkbox if checked will include the table version of any graphical widgets included for easier reading of the data. Various report templates are in PDF or DOCX formats and for some reports there is an option to choose PDF or DOCX formats; DOCX formats can be helpful if there are additional manual edits or write ups that a user wants to include in the report before distributing themselves. When you generate a report, the report downloaded will be saved and queryable in the page if you or others want to re-download without having to re-generate the report.
Reports - Group By Template
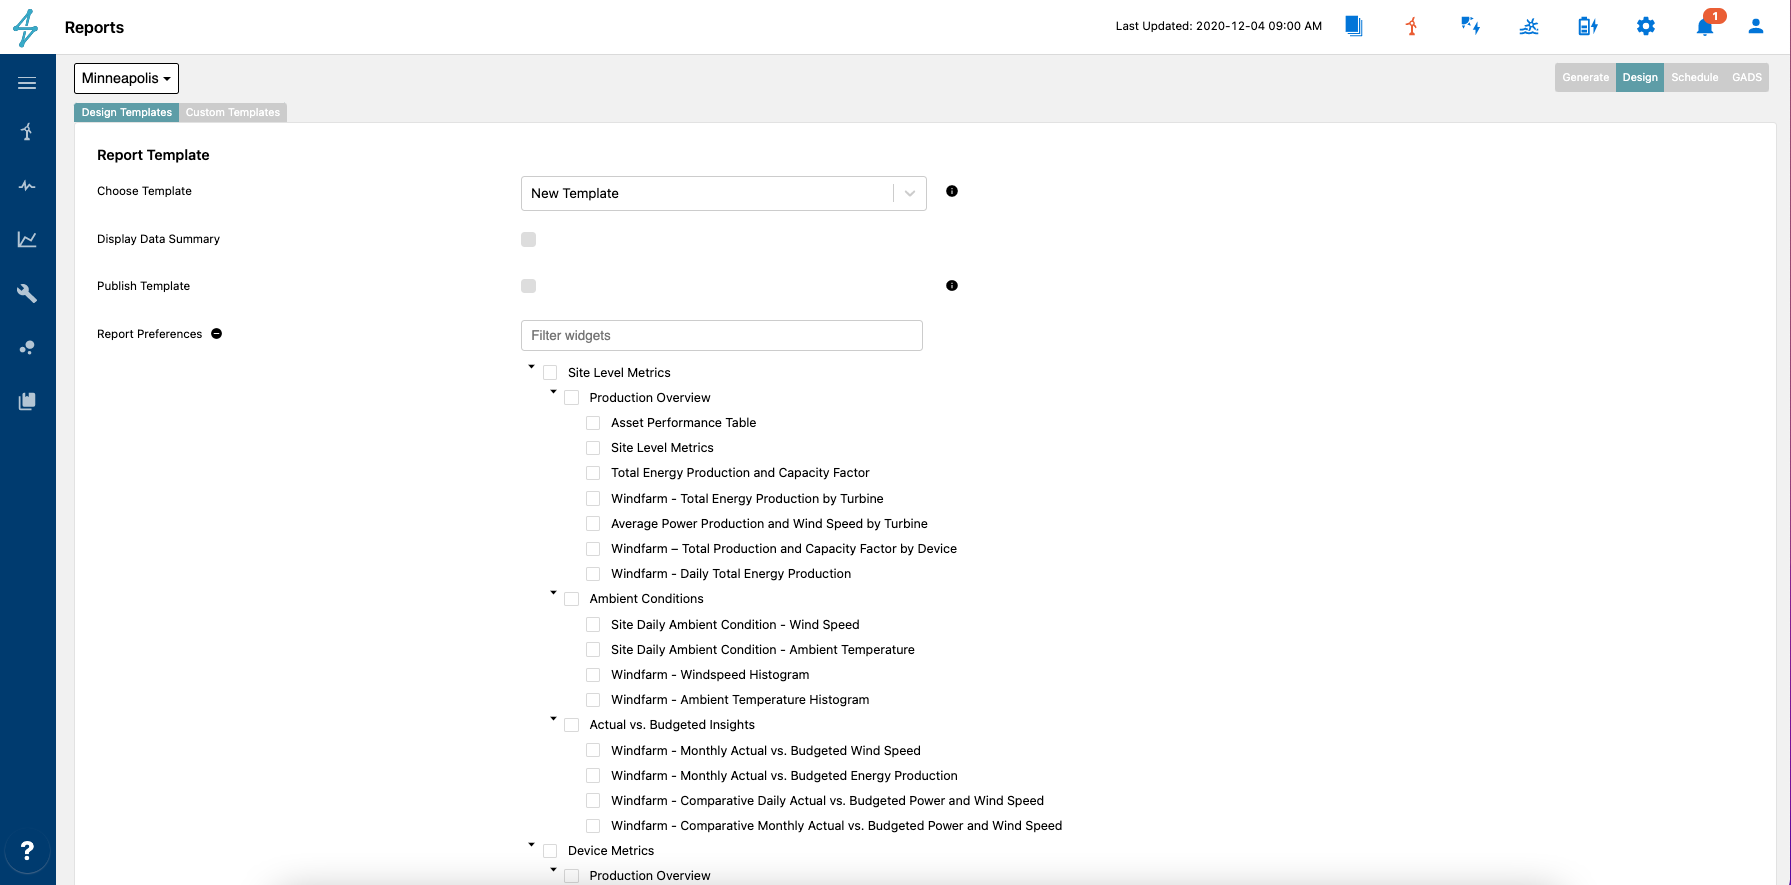
Users can design custom templates that can be used for reports generation on the Generate tab. To create a template simply select list of widgets under Report Preferences list. If you would like to see data tables in the report along with the widget charts then check the Display Data Summary checkbox. To design and schedule reports, you need to have the Report Creator permissions.
Design Reports
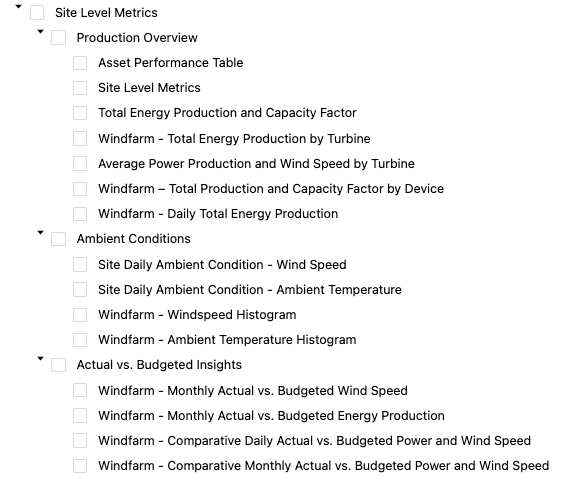
Site Level Metrics include relevant Production, Weather, and Actual vs Budgeted information. These metrics can be important for gaining an overview on performance KPIs and production metrics and what the ambient or weather conditions were on the site for the month. Another important grouping of insights available at the Site Level are the Actual vs Budget. These can help users identify how the asset is performing against modeled or budgeted assumptions.
Device metrics are those on the turbine or inverter level. These can provide beneficial information for looking at how a specific device has performed throughout the week or month. Report categories for Device Metrics include Production Overview, Power Curves, Ambient Conditions, and Downtime information.
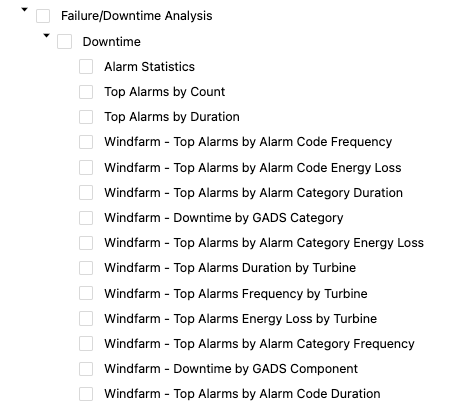
Failure and Downtime analysis metrics are those related to alarms or events reported throughout the reporting period. These categories can help users or stakeholders analyze the common causes, identify trends, and help for spare parts strategies.
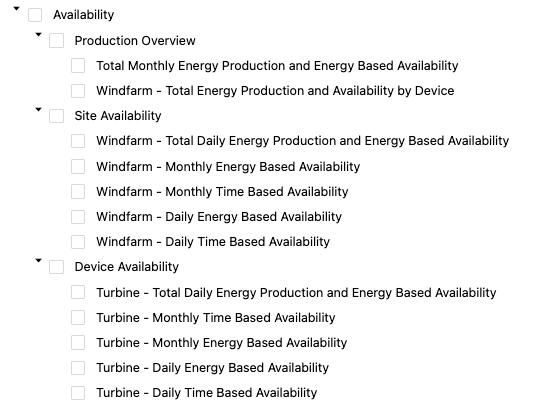
The Availability reporting categories are helpful for users and stakeholders to see asset uptime and production performance throughout the reporting period. These metrics are available on a site level and device level. The site level is helpful for determining overall project performance and the device level can be helpful for looking at individual device performance to help identify underperforming devices that may need additional attention.
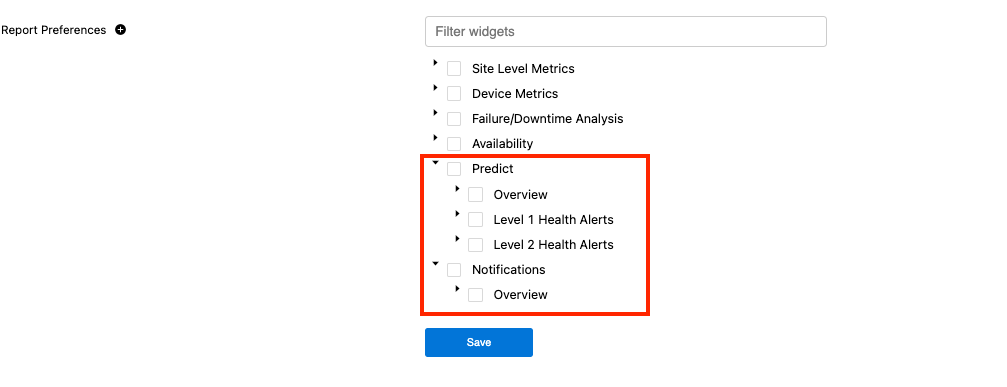
Users can also add information about Predict module alerts and current Notifications created by user-designed notification rules. This can be helpful to quickly create a report highlighting any health alerts.
🚧
Report Length
Adding the Predict and Notification categories to the report can make them very long. It may be useful to have a seperate report for these depending on your reporting requirements.
👍
Publish Templates
Unless a template is published using the Publish Template it will not be available for report generation. Make sure to select the Publish Template checkbox and save the template to make it available for report generation.
Often users would like to receive daily, weekly or monthly reports without having to go into reports generation and manually generating the reports. Using Schedule Reports users are able to create recurring schedules to automatically generate and email reports at desired frequency.
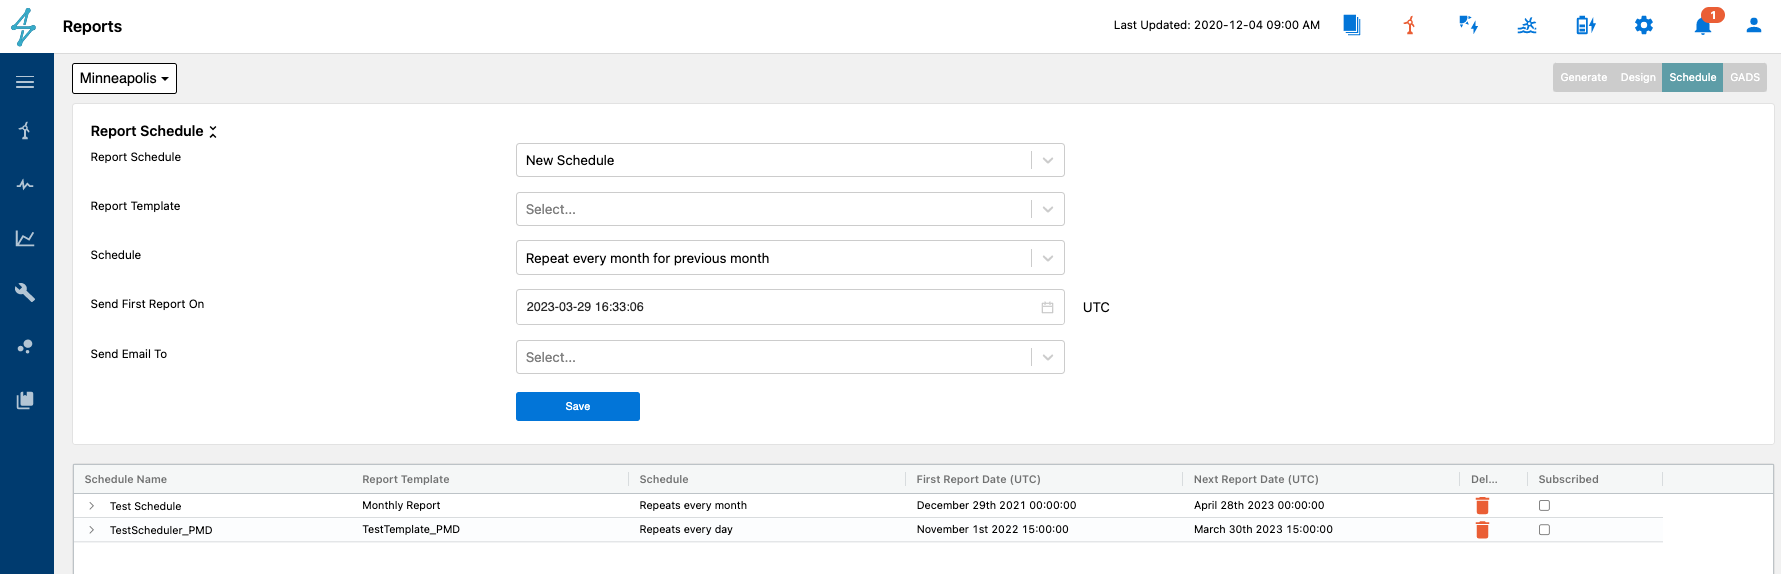
Schedule Reports
To create a custom Excel report, utilize the Data Analysis page in the Analyze module to query the desired information from a variety of data categories from device data to energy loss metrics and many more. By saving a template in Data Analysis, and then checking the checkbox for "save as report", you should then be able to see that Data Analysis template name in the drop-downs for Report Template under both the Generate and Schedule tabs in Reports. See the documentation under Data Analysis for more details.
For requests around custom templates in PDF, Word, or Excel format, please describe the requirements and submit a help ticket using the question mark in the bottom left-hand corner of the Renewable Suite. SparkCognition can also enable a white-labeled header with specific images incorporated in the title page.
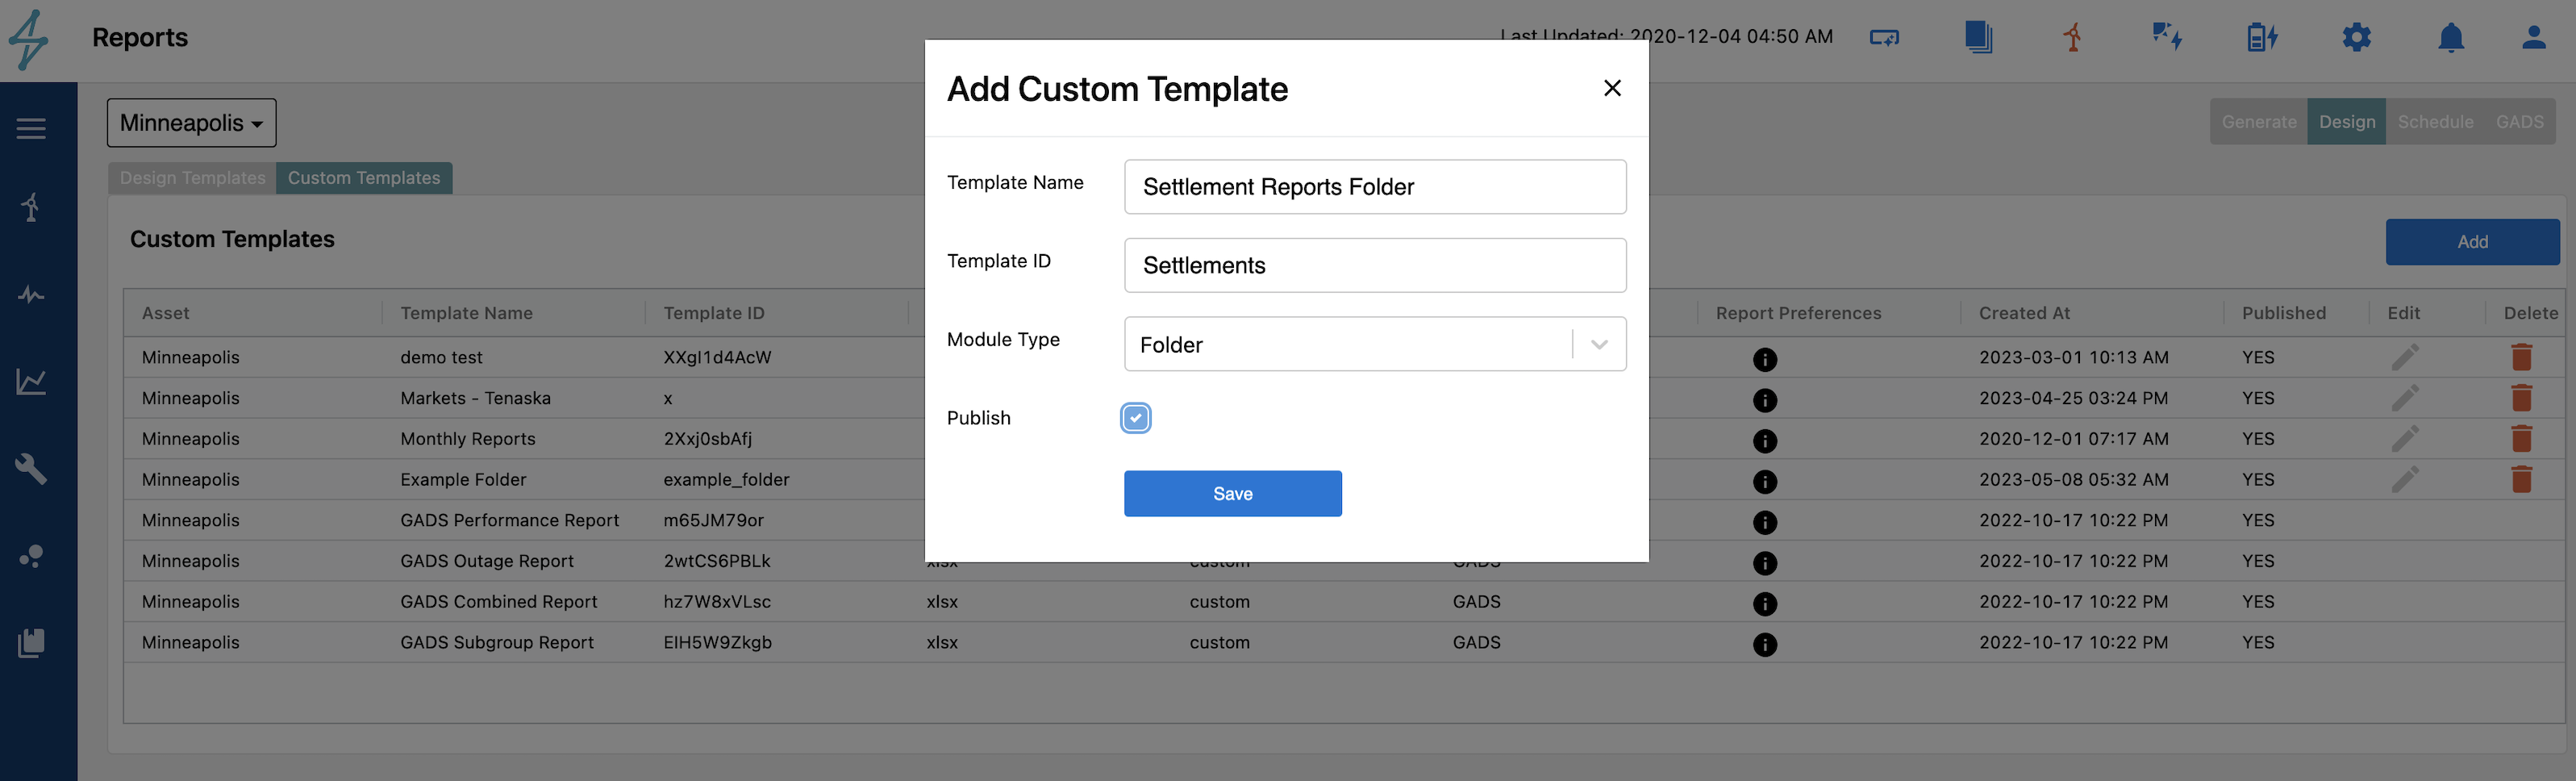
The reports module can become a file system to save all regular reports for an asset and share across users. To utilize the reports module in this way, you should create a new folder to upload documents into. The custom templates is where this is done. Navigate to Reports Module --> Design Tab --> Custom Templates Tab and then Add a template with the button. The pop up will allow you to create a name and attribute it to a Folder Module Type. The Template ID can be an additional label field. Check Publish to make sure the folder is activated so you can find it when you upload to it in the Generate tab.
Now to upload a file to that newly created folder, navigate to the Reports Module --> Generate Tab and select a template of the report folder that is now available in the drop-down. It will ask you for the report name, the start-end date of the report, and for you to upload the file.
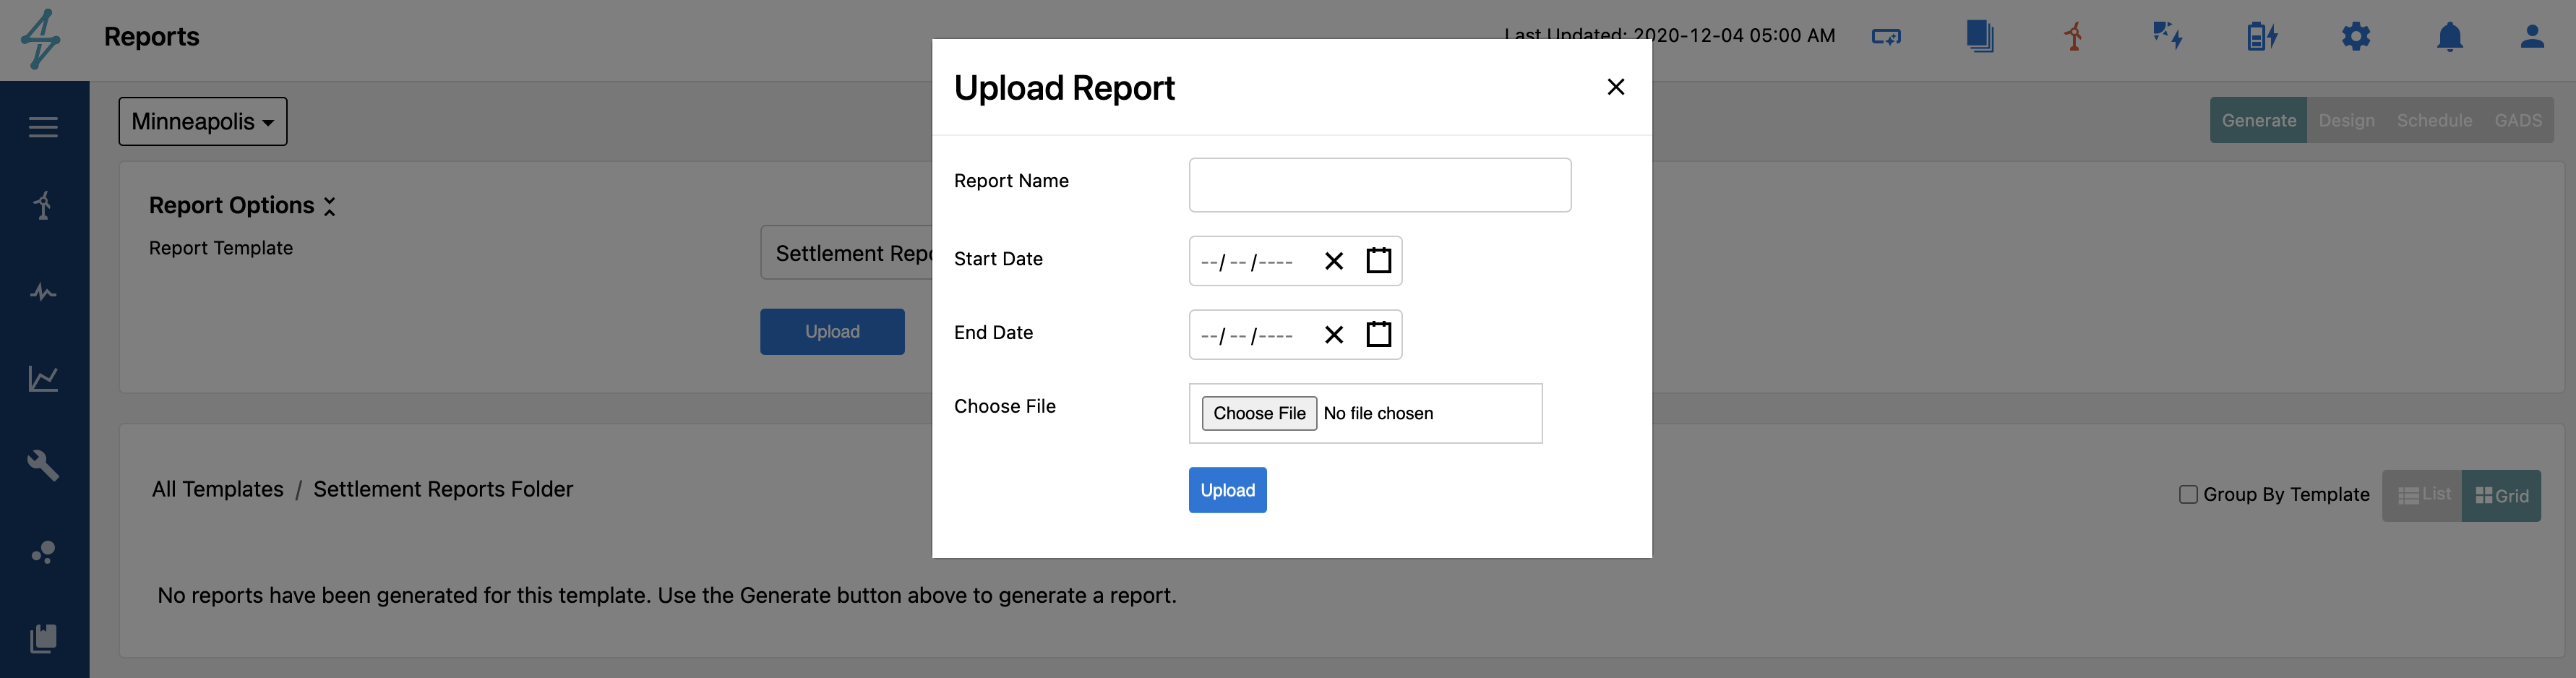
The platform will mark the "Generated at" date as the date/time that you uploaded the report and label the report as the name and period specified.
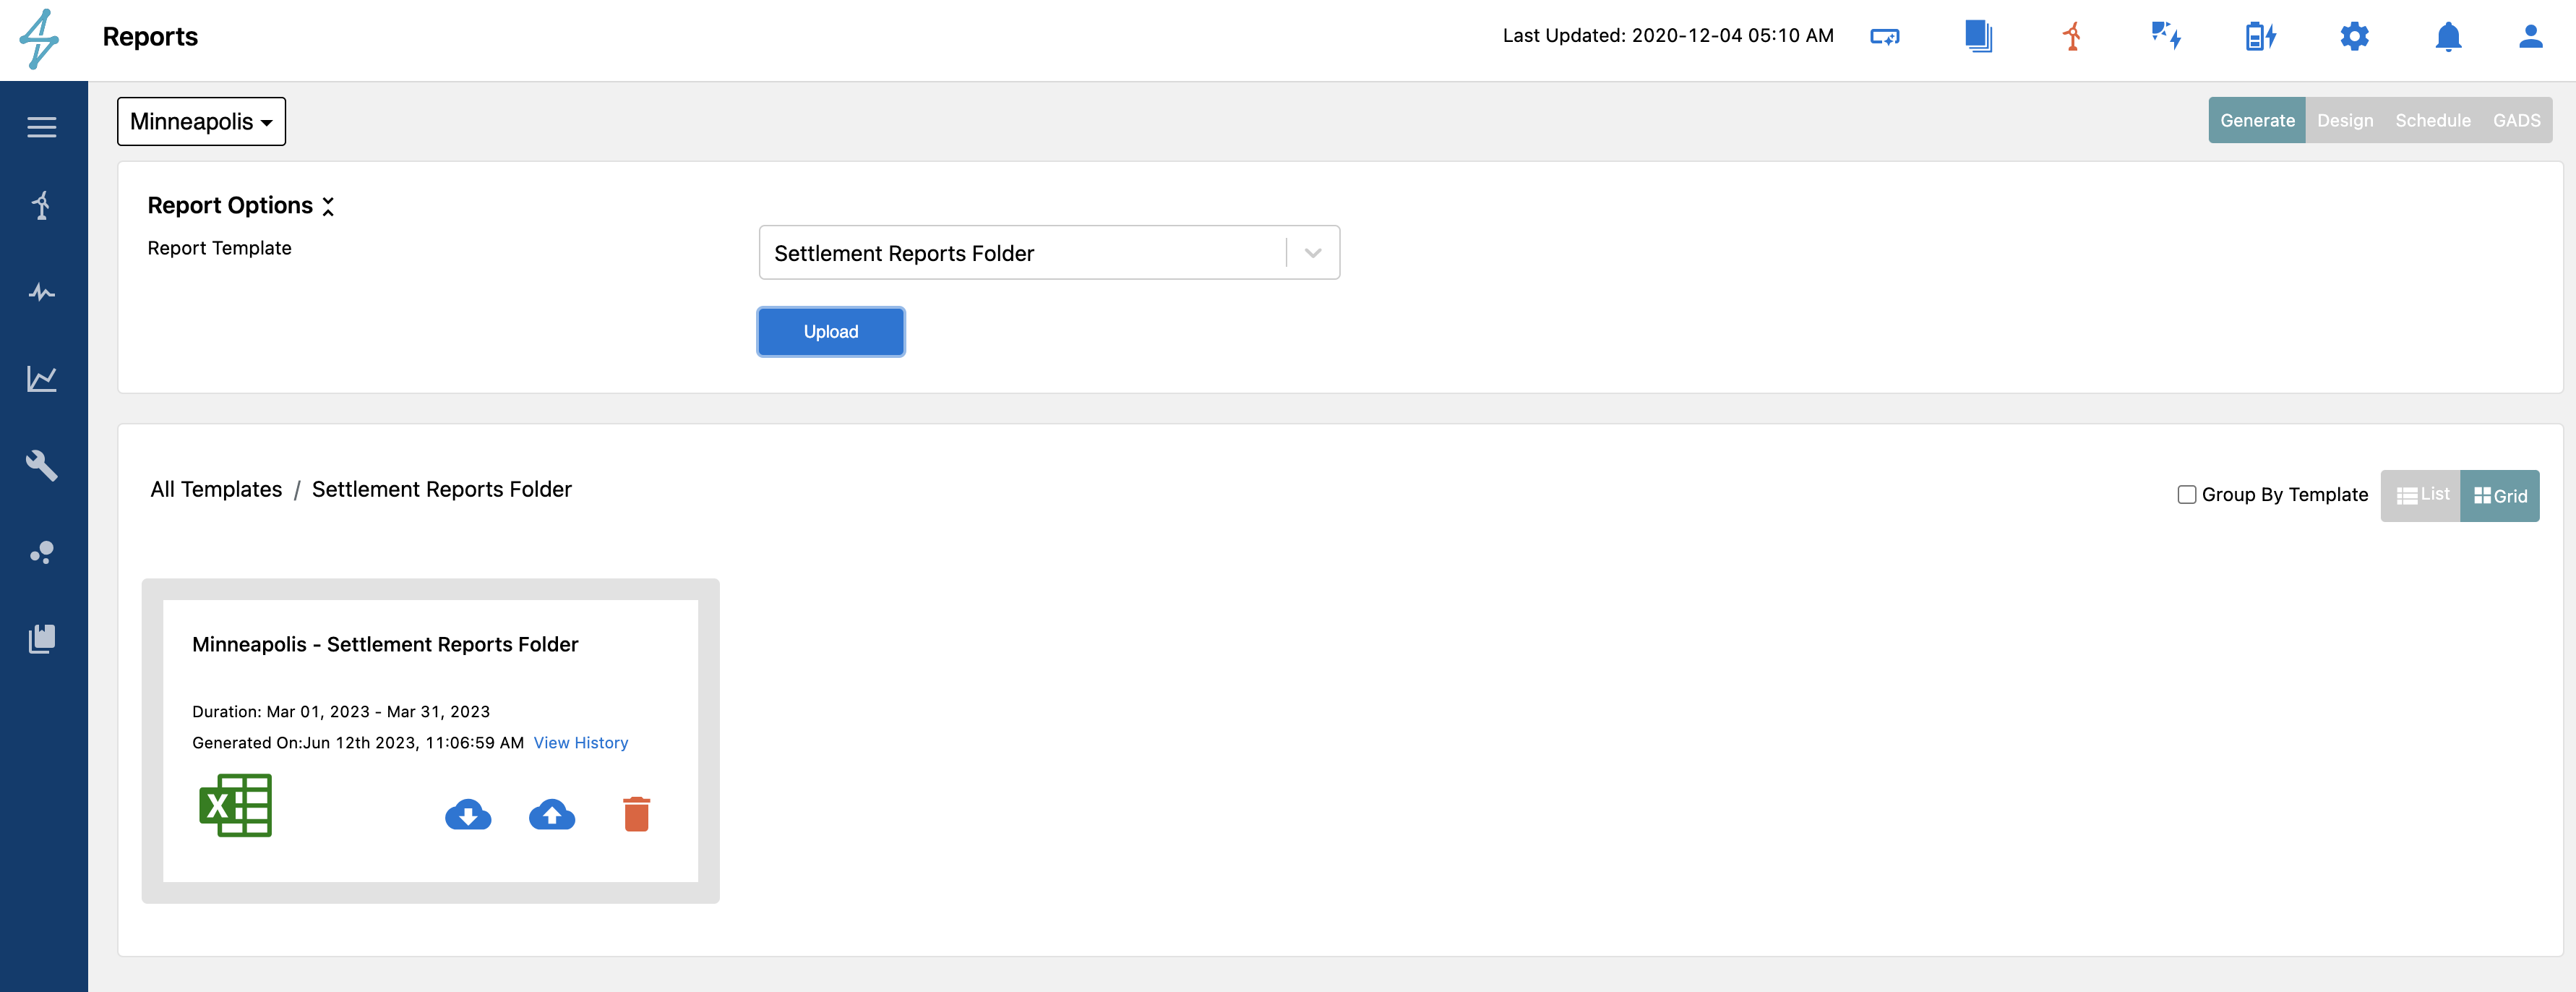
Users can download, upload new copies, or delete reports using the icons on the report. Any re-uploads will be tracked in the view history link so that you can see who uploaded the latest version and when for transparent traceability.
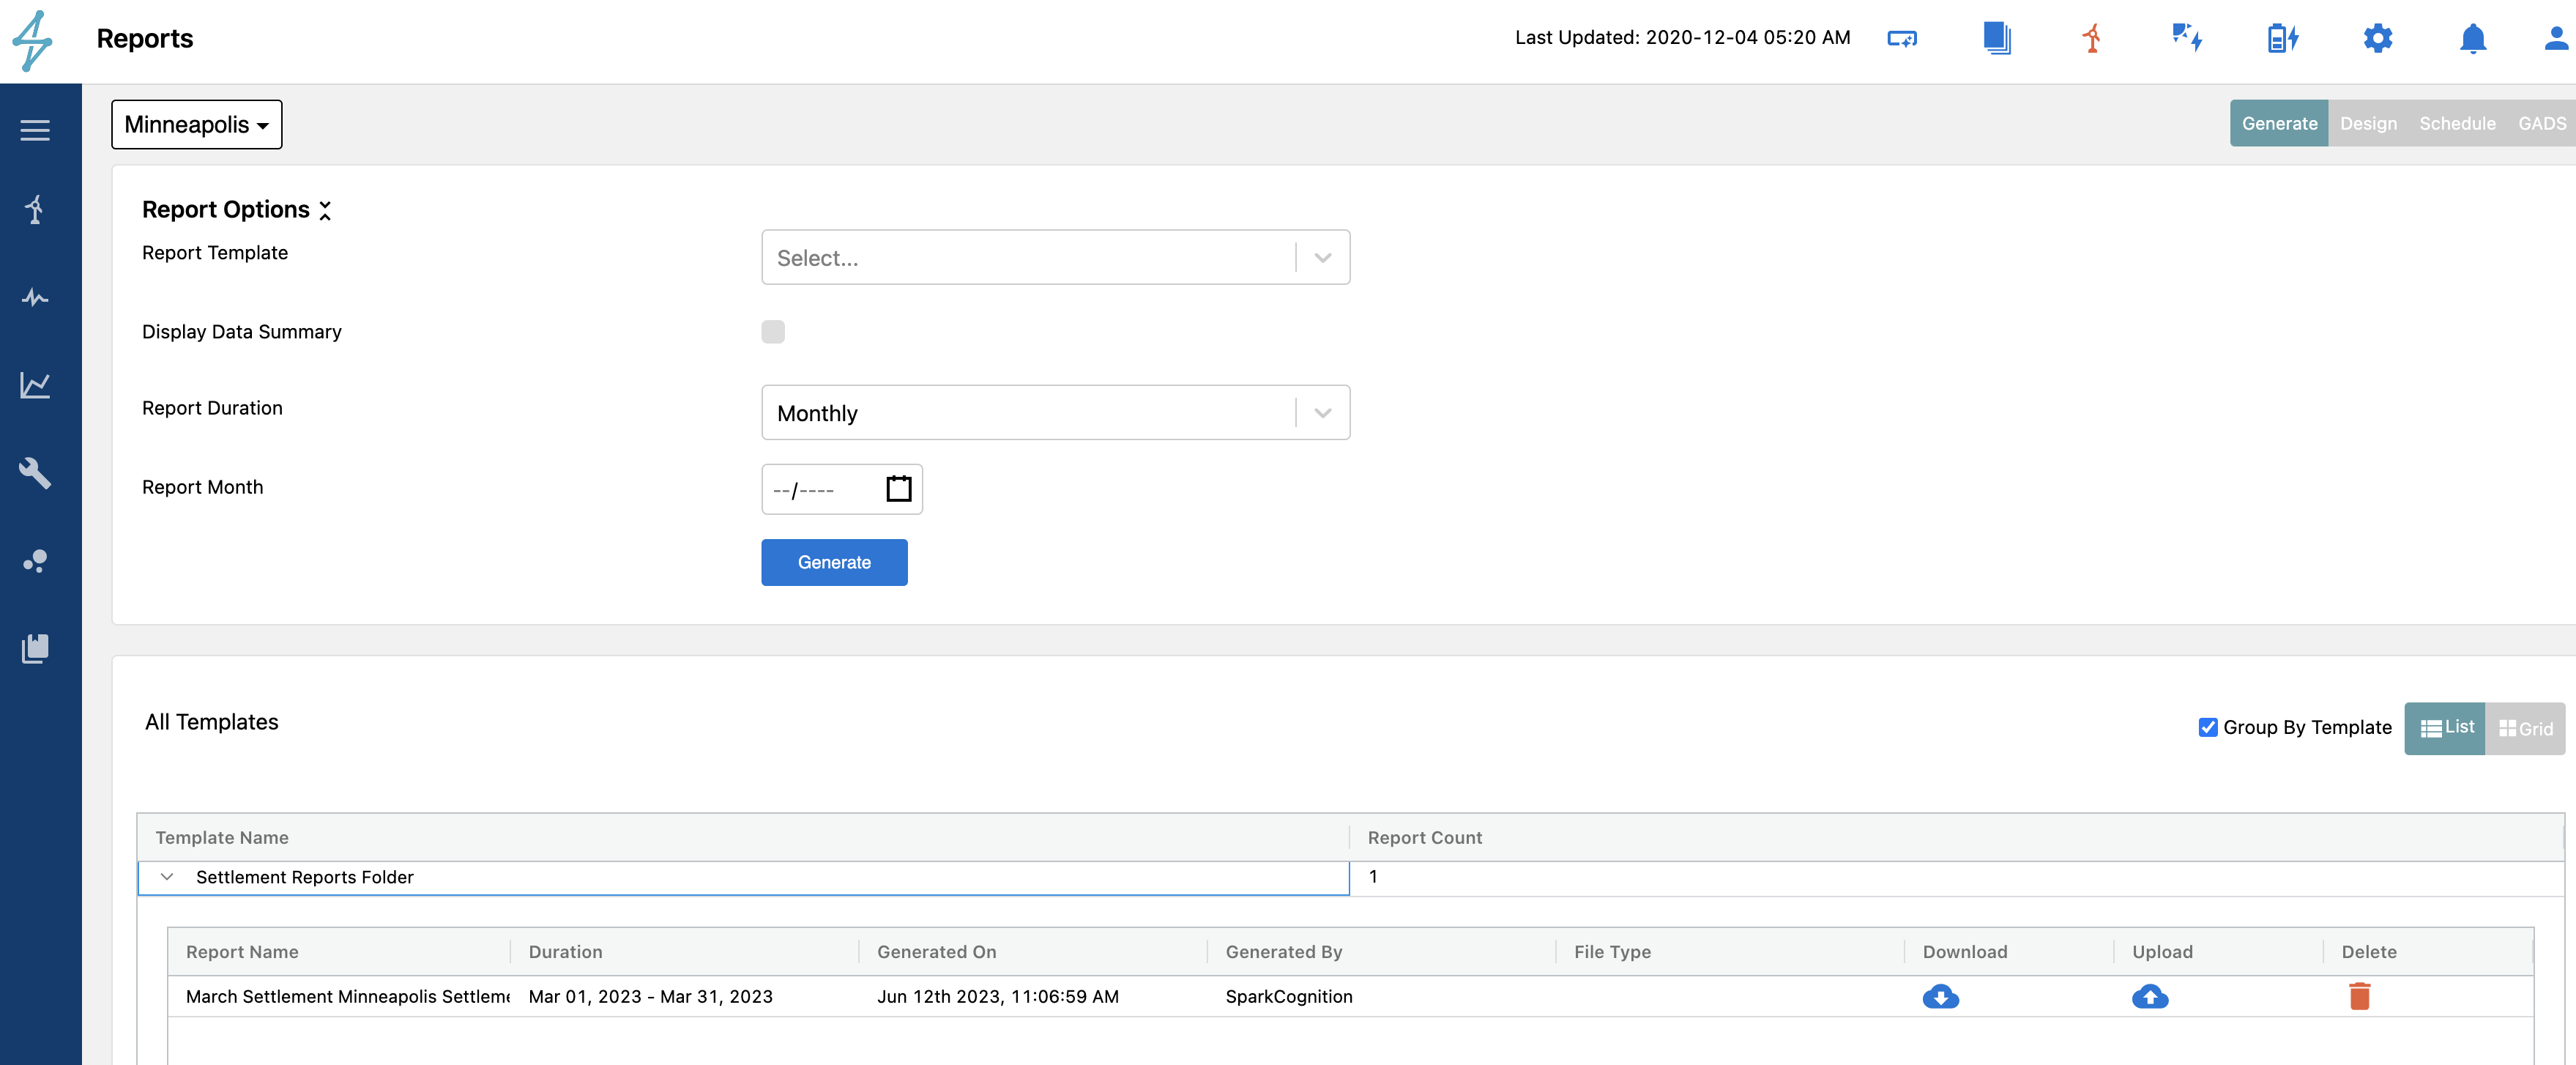
When using the group by template, or list view, when you filter by all report types, this report can be found under the using the folder name as the template name that the page sorts by.