Table of contents Overview Module Updated over a week ago Table of contents
Fleet Overview Module
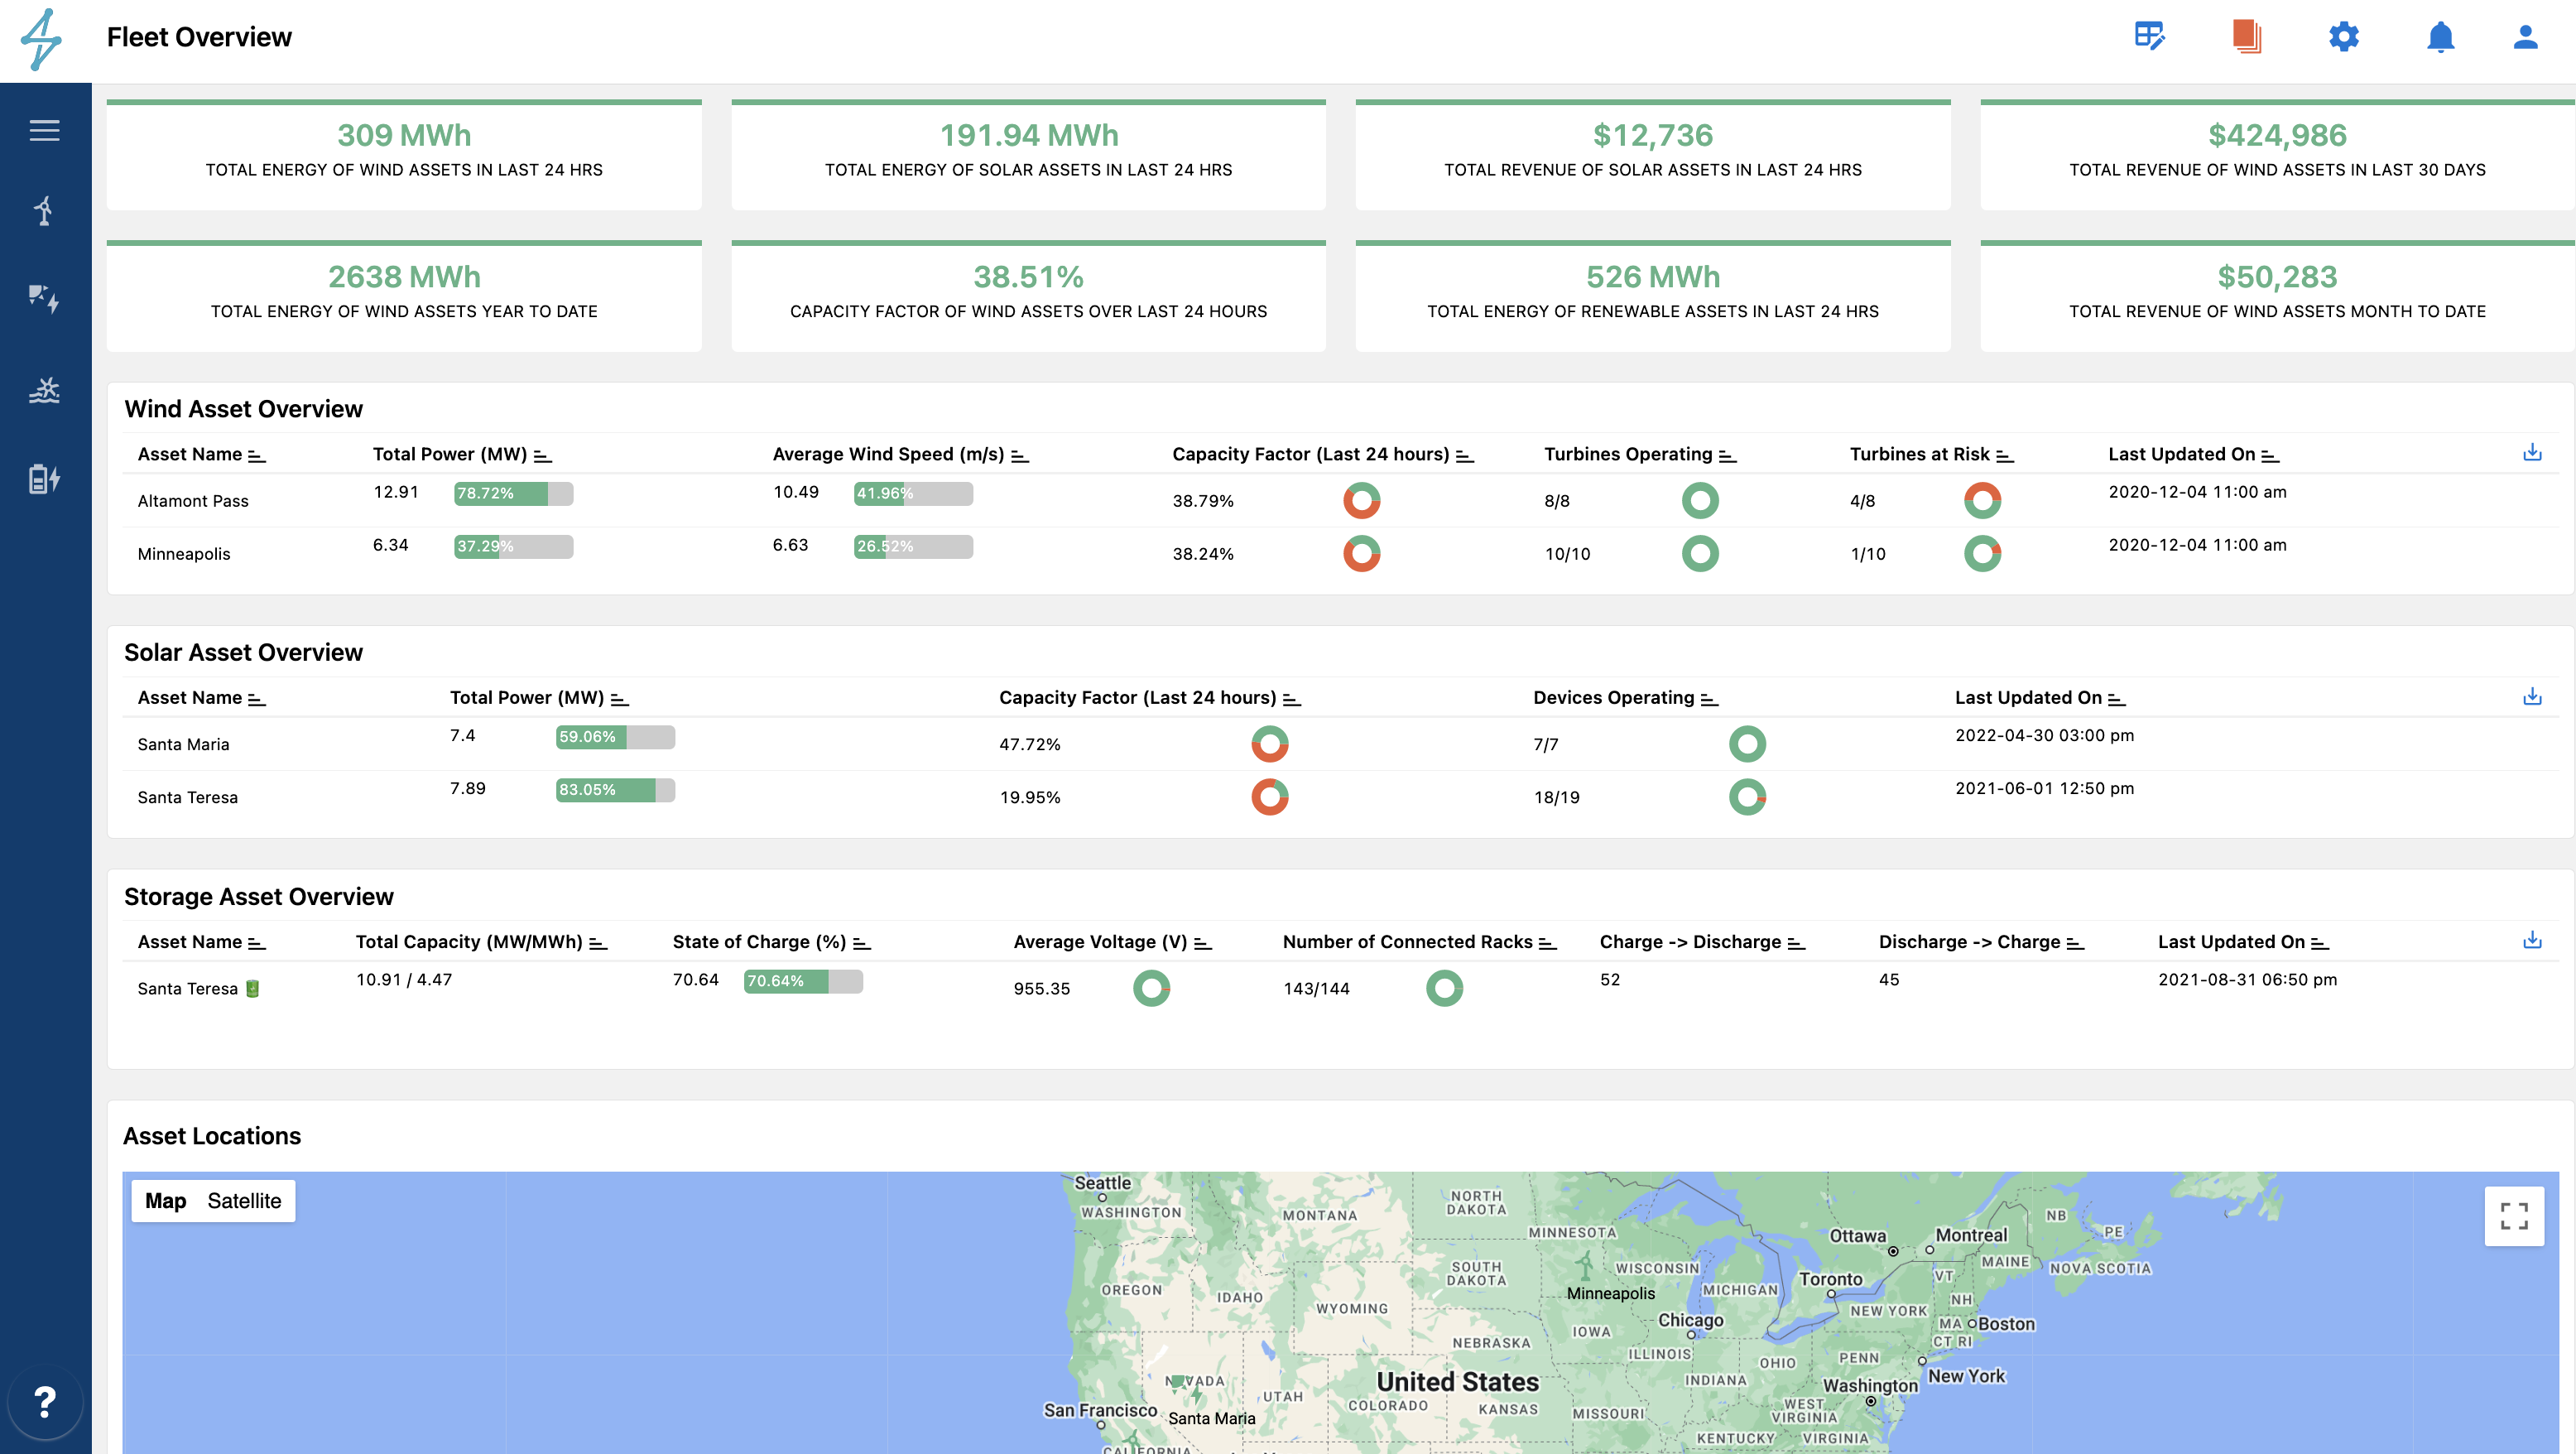
The Overview module is the landing page that most users first see when accessing the platform. It provides fleet level information, and can include information from multiple asset types (i.e. wind, solar, hydro, and storage) in one location. The type of information which can be seen in the Overview module includes energy production, revenue, downtime, availability, and alarms data. This module along with many others in the Renewables Suite platform can be customized to reflect the metrics and KPIs that are important to the individual user type accessing it.

The Overview module KPIs for each asset include Total Power (MW), Average Wind Speed or Irradiance, Capacity Factor, Turbines or Inverters operating, and Turbines at Risk as calculated by the predict module

Wind
Total Power (MW) : Near live power output of the site in MW
Actual Wind Speed : Reported Average Wind Speed at Turbine in m/s
Capacity Factor (Last 24 Hours) : Adjusted Production / Production Capacity last 24 hours
Turbines Operating : Number of turbines operating out of the total turbines at the site
Turbines at Risk : Number of turbines that require attention based on the Renewables Suite Platform algorithms
Last Updated On : Date and time that the last data update was completed
Solar
Total Power (MW) : Near live power output of the site in MW
Capacity Factor (Last 24 Hours) : Adjusted Production / Production Capacity last 24 hours
Devices Operating : Number of inverters operating out of the total inverters at the site.
Devices at Risk : Number of inverters that require attention based on the Renewables Suite Platform algorithms
Last Updated On : Date and time that the last data update was completed
Storage
Total Capacity (MW/MWh) : Typically expressed as Rated Power / Energy capacity or the maximum rate of discharge / the maximum amount of stored energy
State of Charge (%) : The current level of charge of the energy storage system relative to its total capacity
Average Voltage : The average voltage within the battery storage system
Number of Connected Racks : Number of connected battery racks within the energy storage system
Charge->Discharge : The total number of completed charge cycles of the energy storage system
Discharge->Charge : The total number of completed discharge cycles of the energy storage system
Last Updated On : Date and time that the last data update was completed
Asset locations can be viewed in the map on the overview page, this can also be switched to a full screen view by clicking the icon in the top right of the pane.

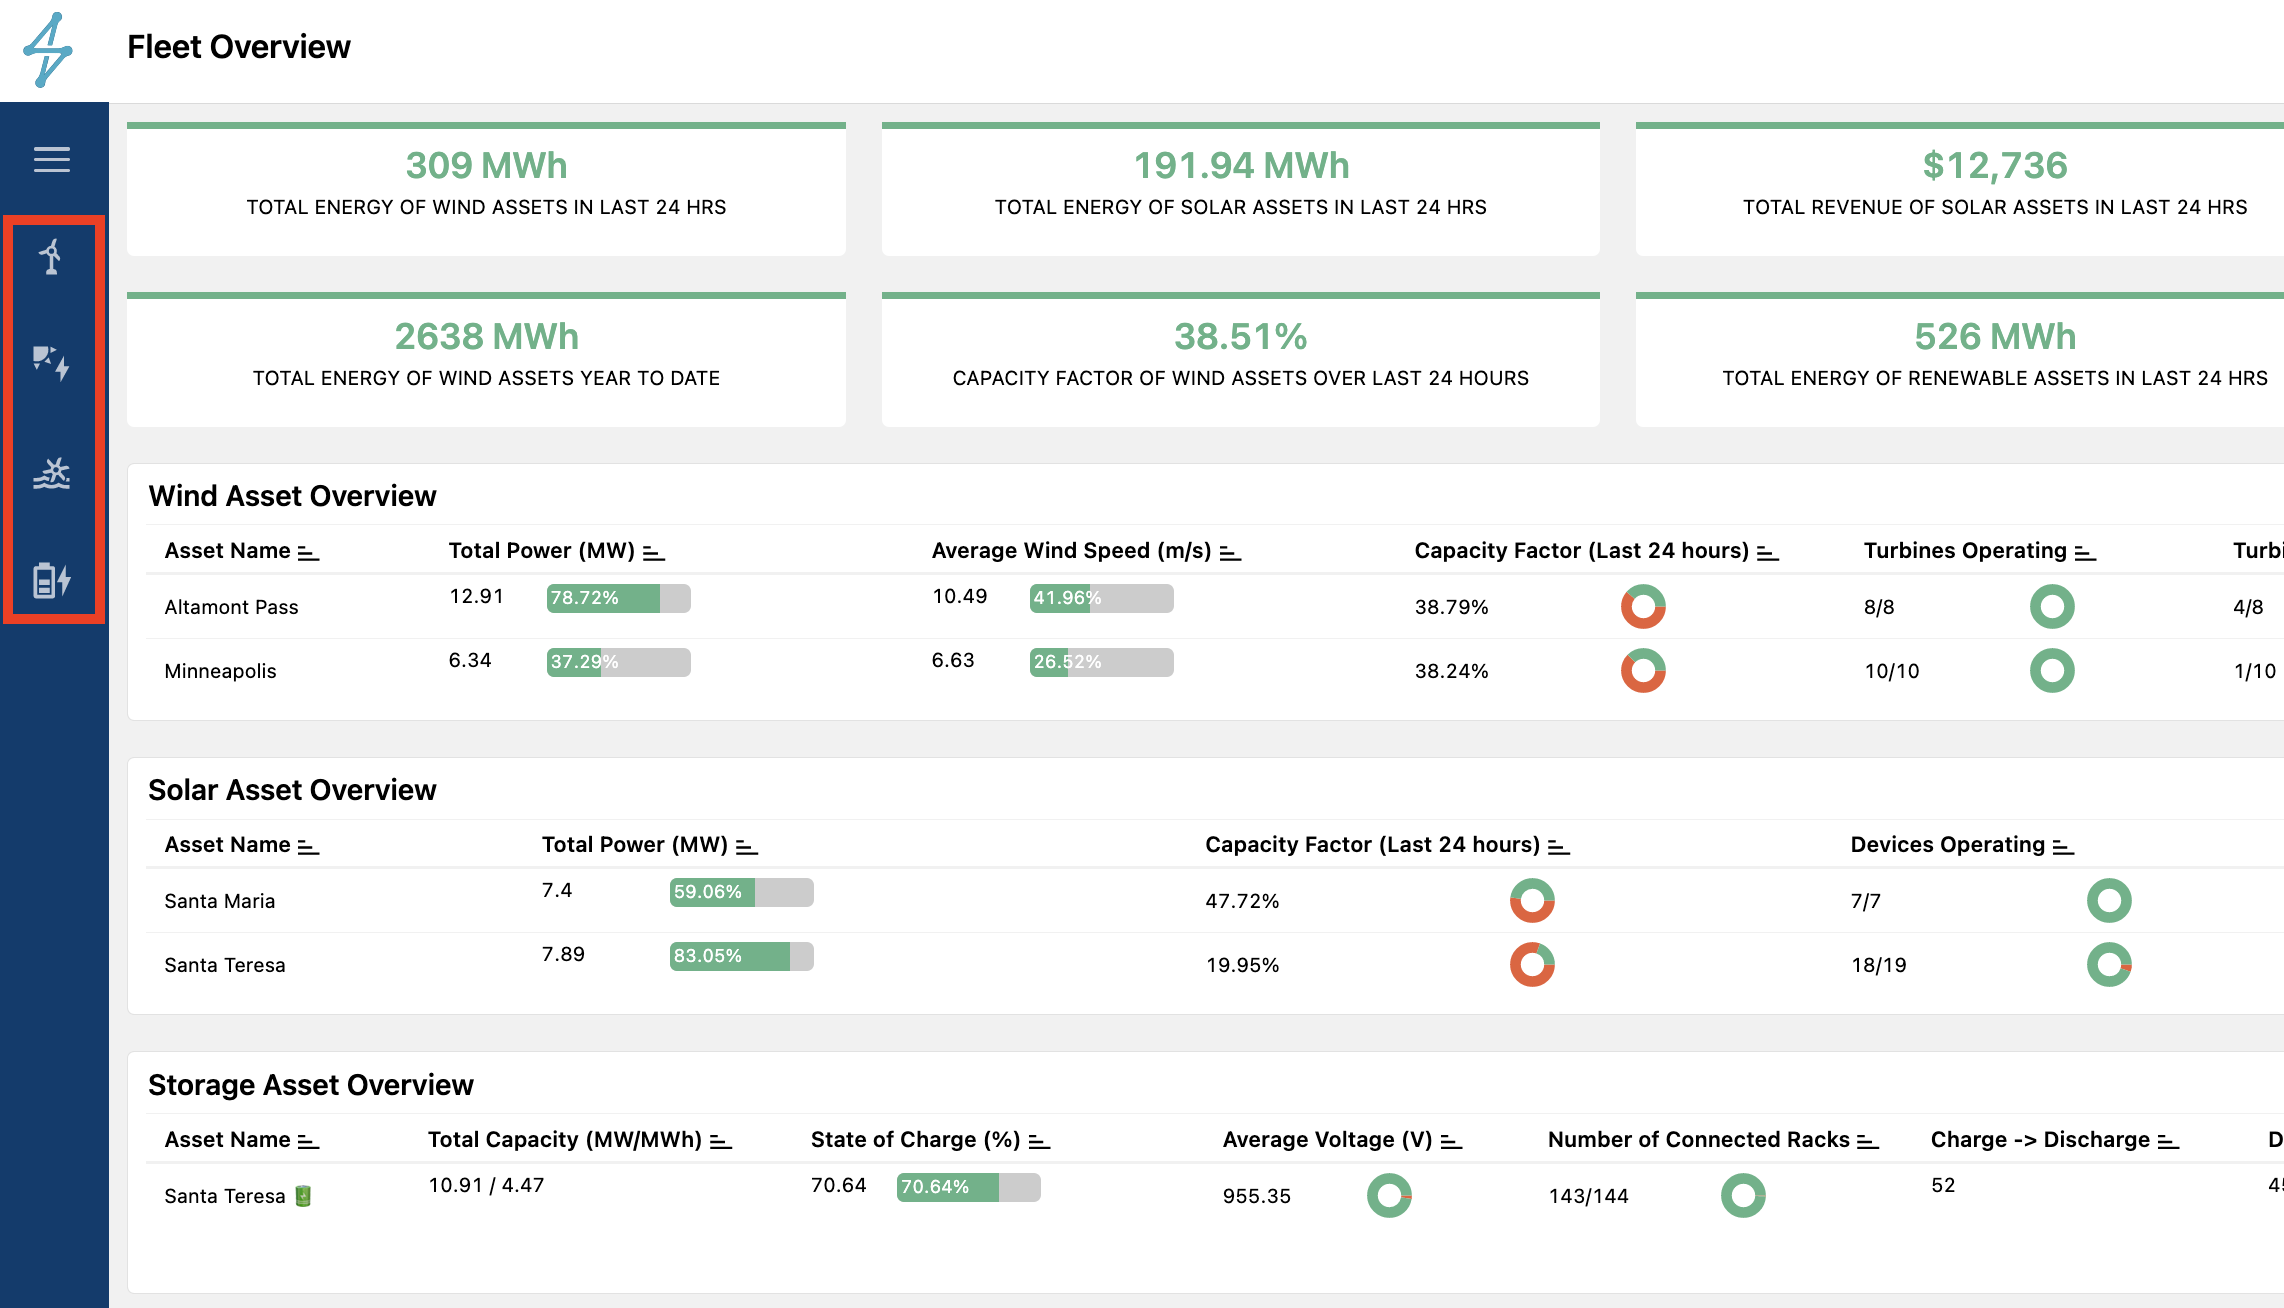
From the Overview module you can access the Overview module's for a specific asset type by clicking on specific asset type icon on the left.

Asset Overview
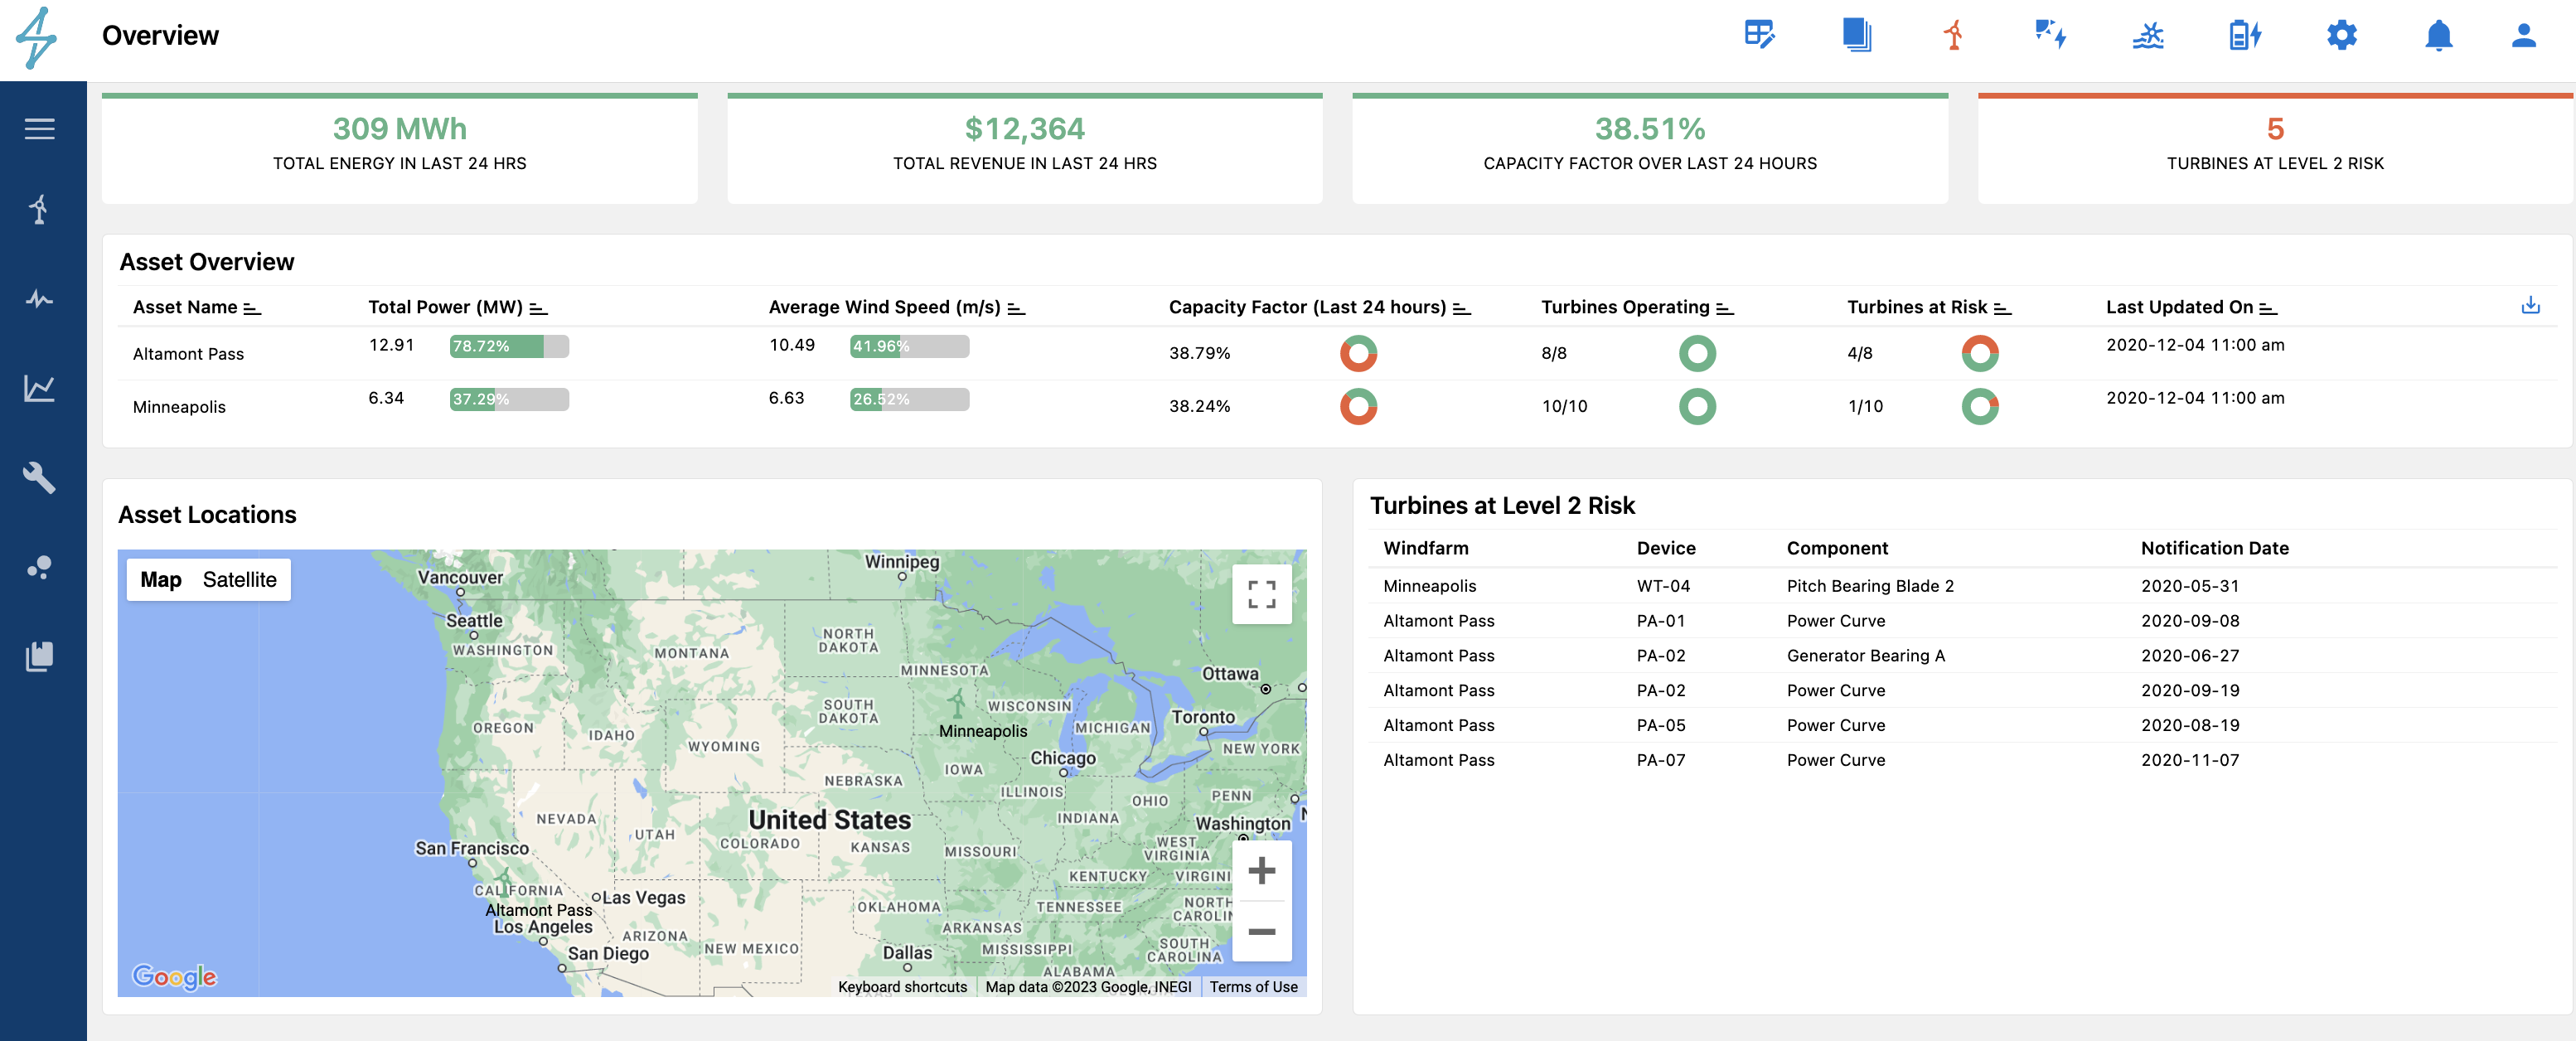
Similar to the fleet overview there are specific overview modules for each asset type in the user's fleet. In our examples, the user has three different asset types, Wind, Solar, and Energy Storage.
In this instance the user accessed the Wind Overview by from the Fleet Overview by clicking on the solar specific icon on the toolbar on the left side of the platform view. The same applies for Solar and Energy Storage assets.

On the Asset Overview page the user will see similar KPIs and information as on the Fleet Overview, but specific to the asset class overview the user is viewing.
Next, the user's can take a deeper dive into a specific assets operating data and performance by accessing the Monitor module
