Table of contents Overview Module Customization Updated over a week ago Table of contents
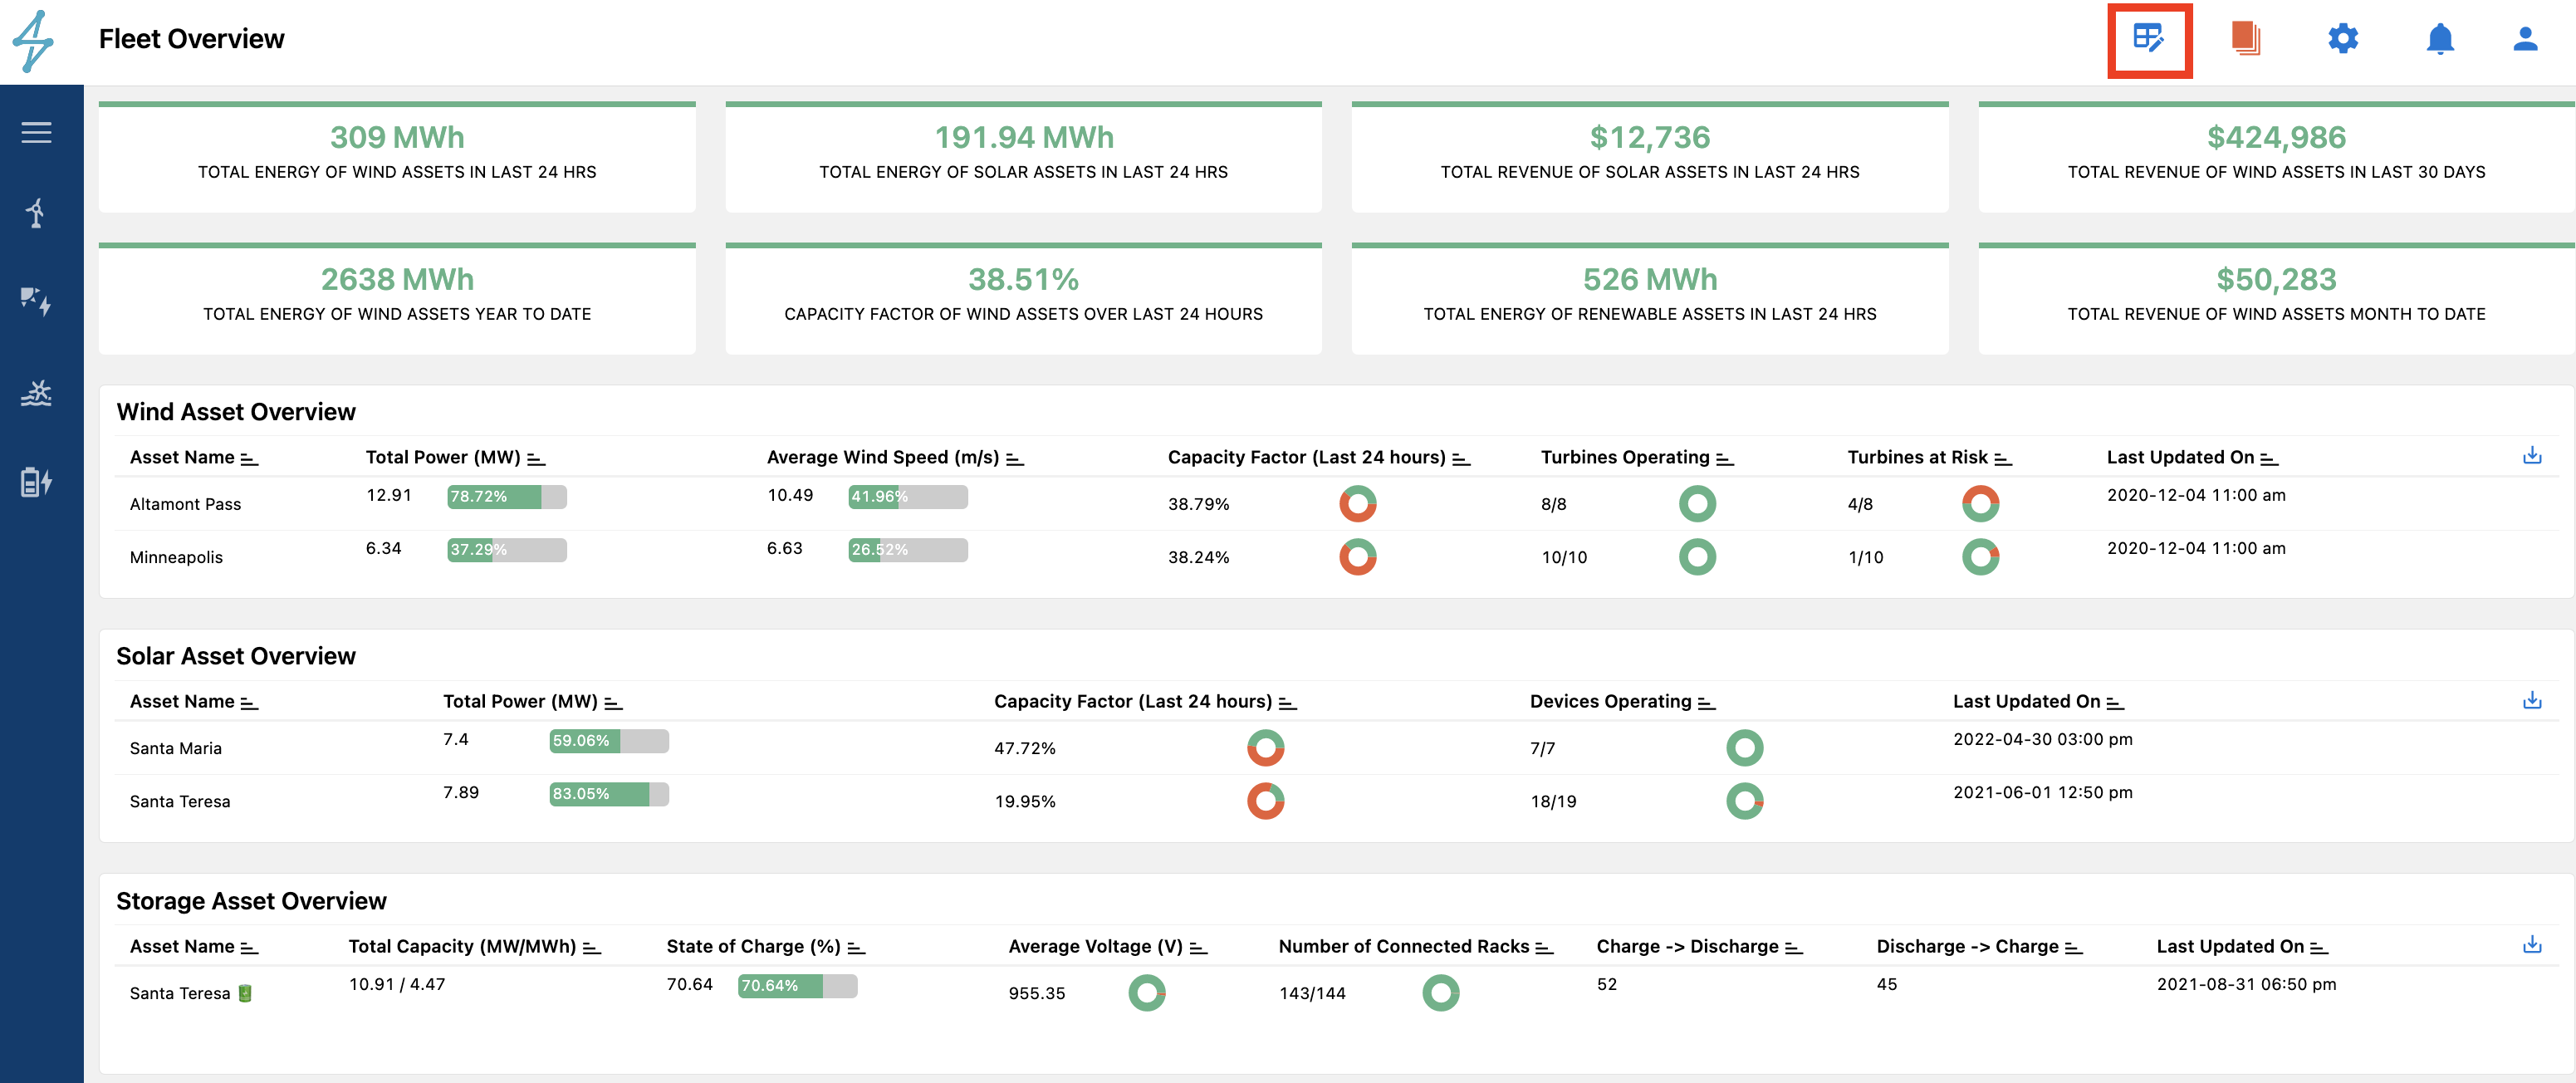
The SparkCognition Renewables Suite platform allows each user to customize the platform to show KPI's, including charts and table widgets, based on their preference. Users can personalize the platform to show widgets they prefer by using Custom Widgets option in the top bar. These customizations apply only to the user's profile making the modifications allowing for flexibility for each user to create a view that highlights the most important metrics to them.

Custom Widgets
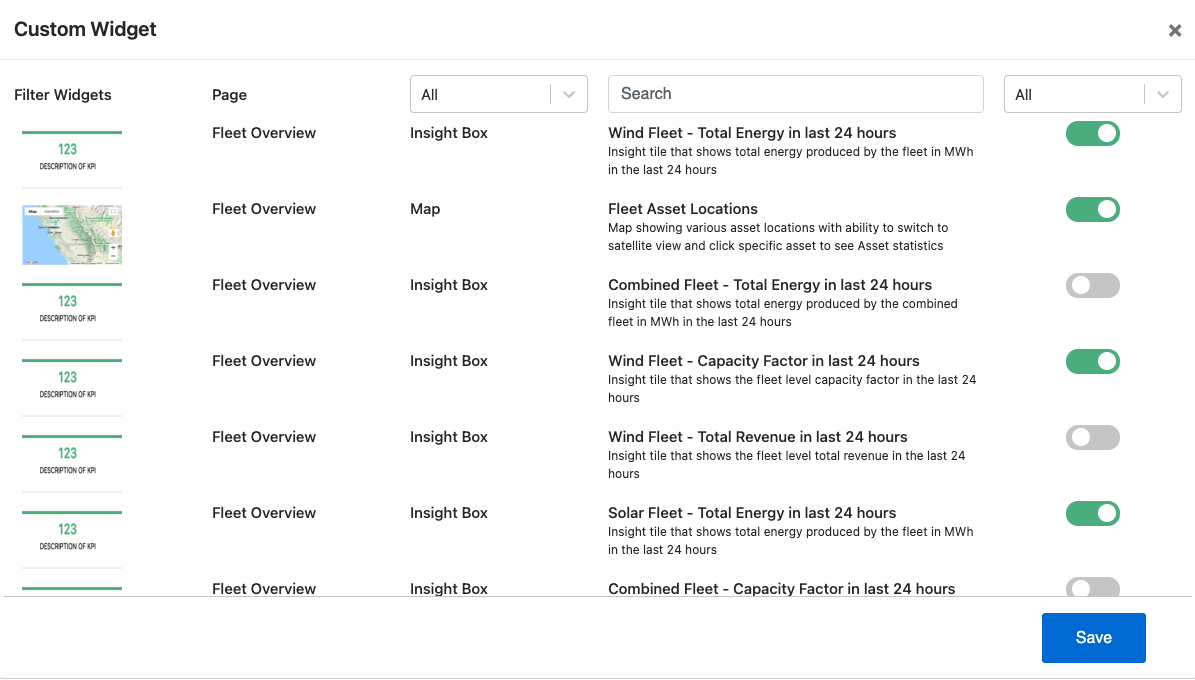
Once the user has selected the Custom Widgets icon, a complete range of KPIs becomes available to toggle on and off on the right. These can be filtered by Widget type such as Chart, Insight Box, Map, Table, Gauge, and Drill Down Chart. The search box above the forth column from the left, shown in the image below, allows for the user to quickly find the metric or KPI they are looking to utilize.

Once the desired widget has been toggled on, click save and exit the customize menu. Then the module will refresh and the new widget will appear. To remove widgets the same process applies.
Dashboard Customization Walkthrough Video
The short video below shows how the Overview module can be customized for each user.
