Table of contents OEM Comparison Updated over a week ago Table of contents
The OEM Comparison tab is helpful for users to compare Renewables Suite calculated availability and KPIs to that of the OEM for the site. This feature is enabled if OEM reports are available and provided to SparkCognition for upload to the platform. All major OEM's are supported by the OEM comparison tool.
Accessing the OEM Comparison tab
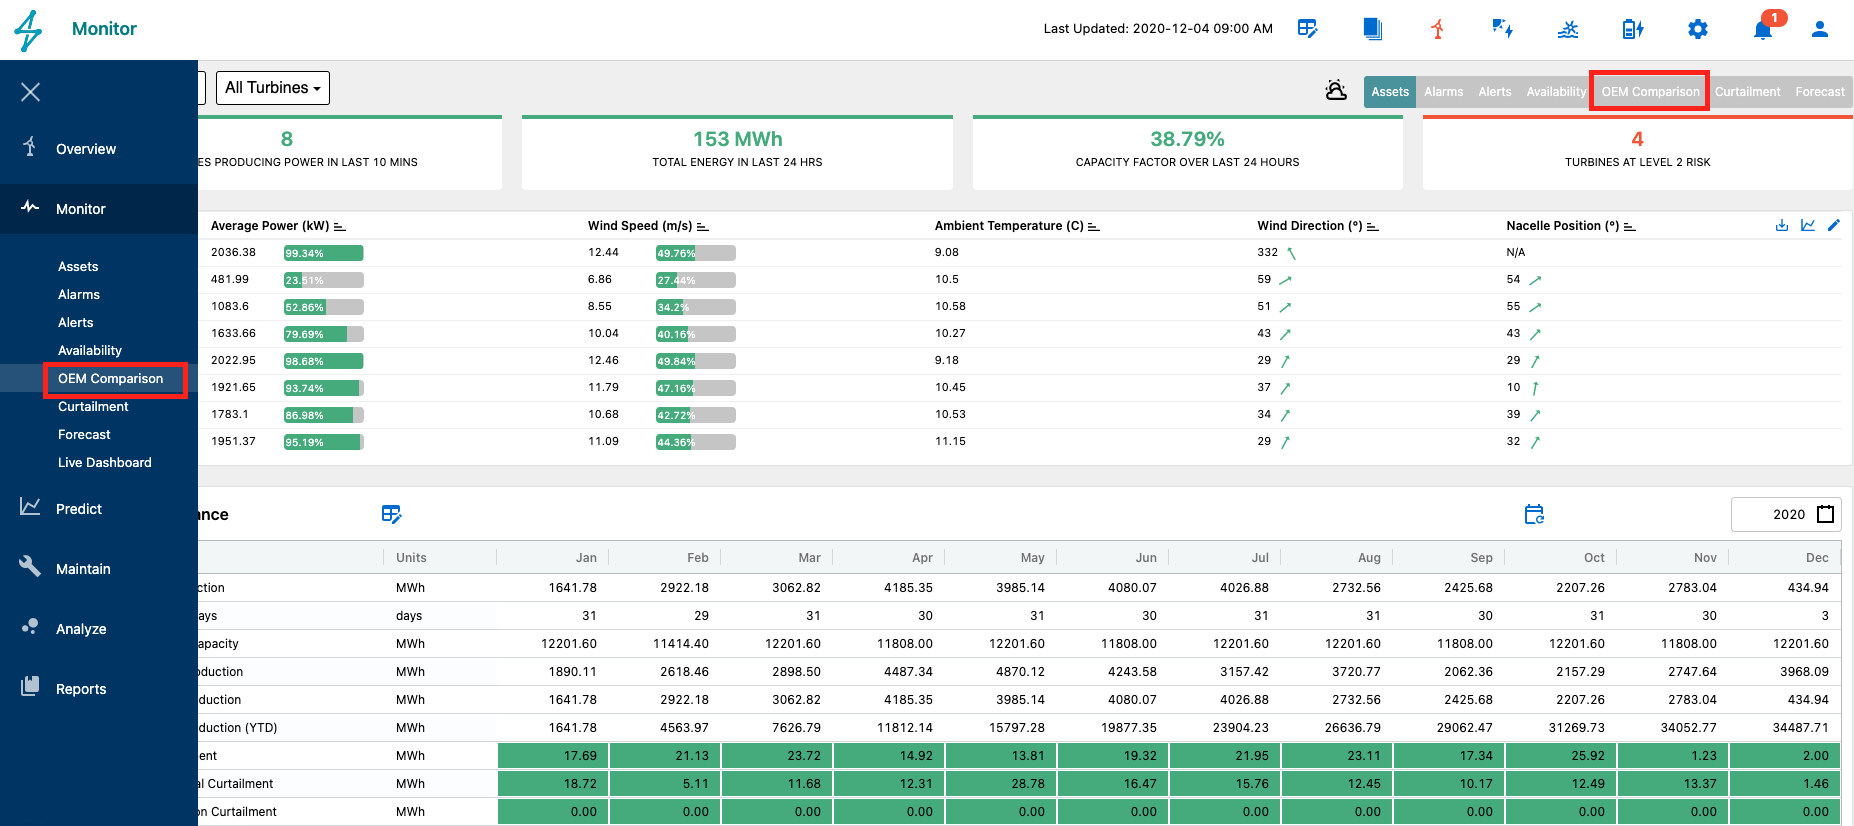
The OEM comparison tab can be accessed from the Monitor module of a specific asset by the left-side toolbar or by clicking on the OEM Comparison tab in the top right corner of the Renewables Suite platform.

OEM Comparison tab features
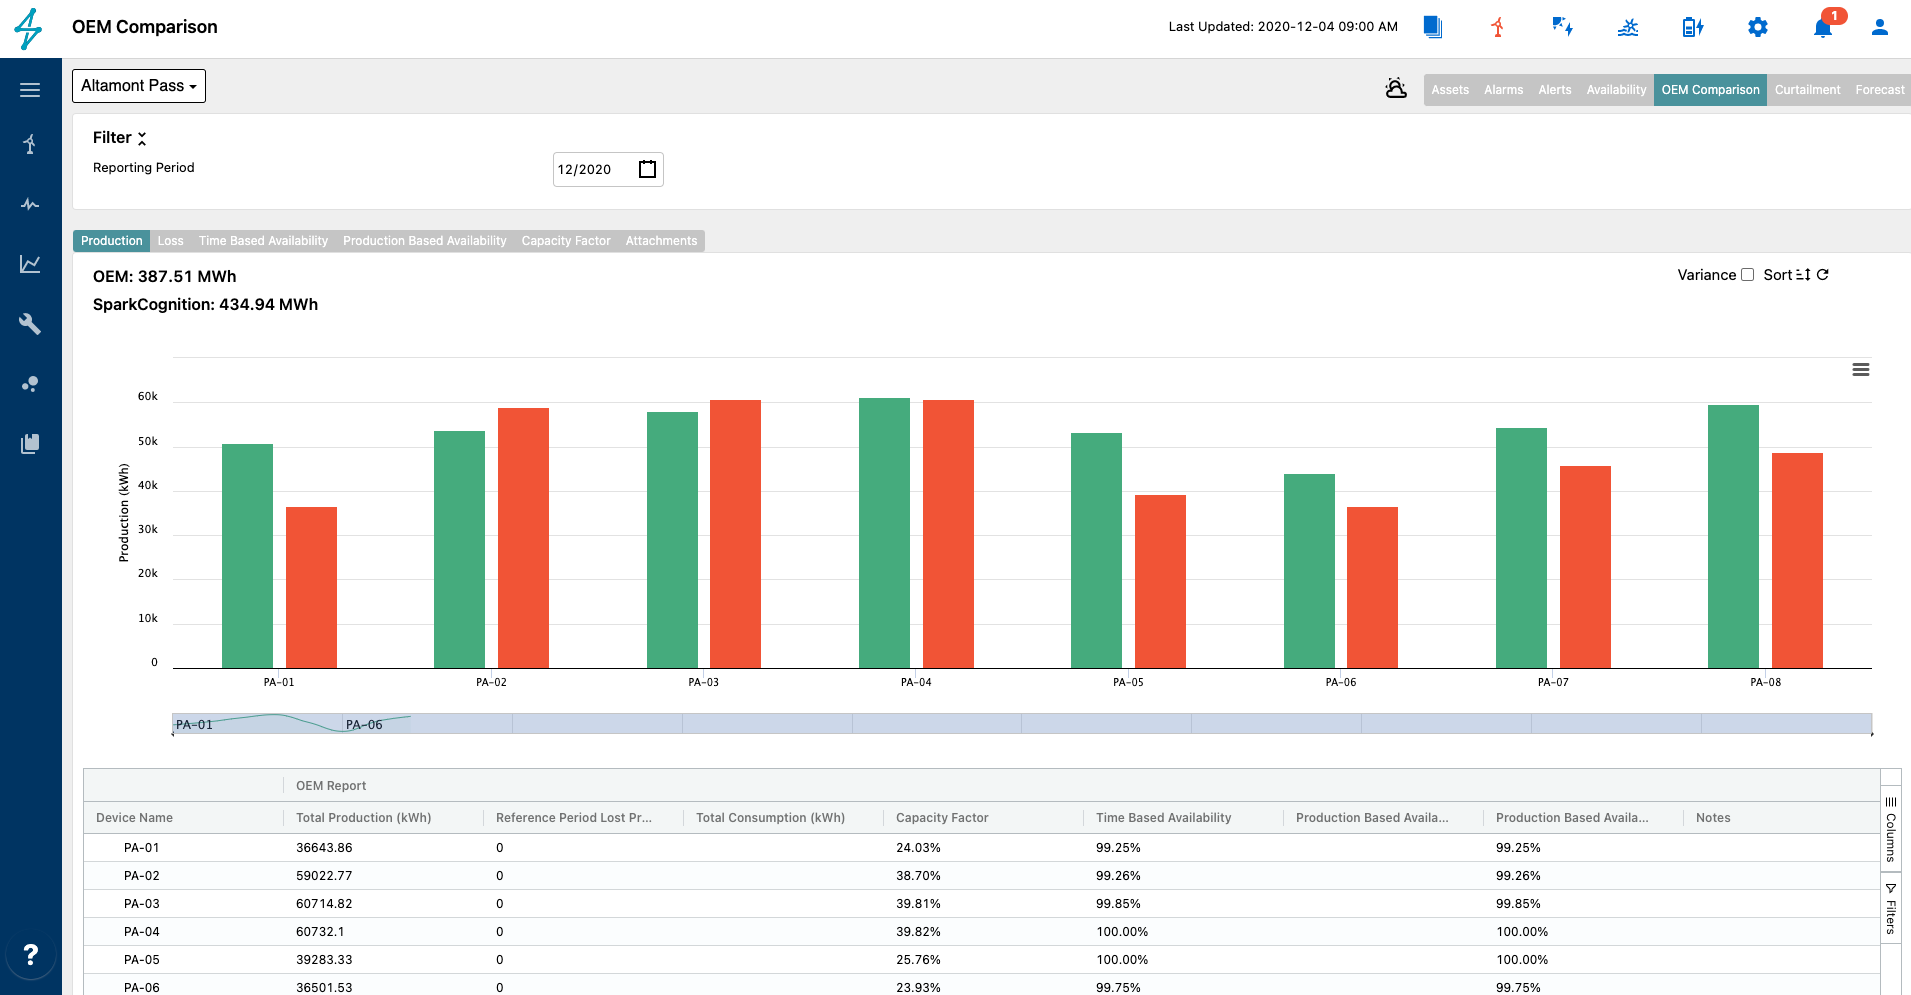
Once on the OEM Comparison tab there are an additional 6 tabs for users to utilize to quickly see the variance in values from the OEM and Renewables Suite. These are as follows.
-
Production: Compares OEM versus Renewables Suite production numbers by device.
-
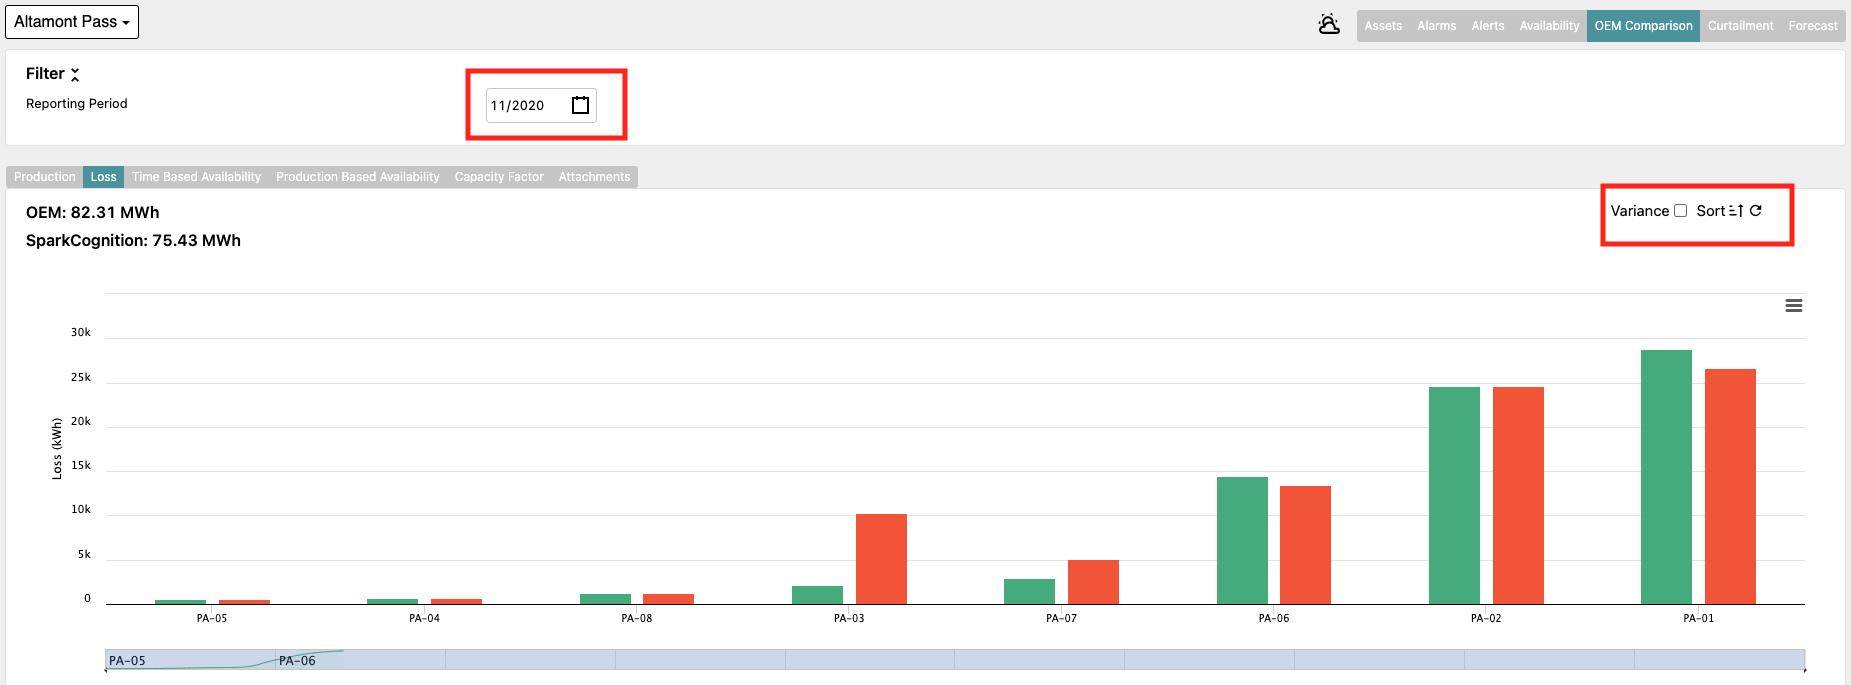
Loss: Compares OEM versus Renewables Suite calculated energy loss numbers by device.
-
Time Based Availability: Compares OEM versus Renewables Suite calculated time based availability numbers by device.
-
Production Based Availability: Compares OEM versus Renewables Suite calculated production based availability numbers by device.
-
Capacity Factor: Compares OEM versus Renewables Suite calculated capacity factor by device.
-
Attachments: Allows for users to upload and attach reports or other files for future use.
Production: Compares OEM versus Renewables Suite production numbers by device.
Loss: Compares OEM versus Renewables Suite calculated energy loss numbers by device.
Time Based Availability: Compares OEM versus Renewables Suite calculated time based availability numbers by device.
Production Based Availability: Compares OEM versus Renewables Suite calculated production based availability numbers by device.
Capacity Factor: Compares OEM versus Renewables Suite calculated capacity factor by device.
Attachments: Allows for users to upload and attach reports or other files for future use.

Users can select different months by using the date picker on the filter tool bar.

On the plot, users can also select variance for a different view showing just the variance between the OEM and Renewables Suite numbers. Sort can be used to rearrange to be ascending or descending by device totals.

The attachment tab allows users to upload any files to Renewables Suite such as OEM Monthly Reports, Excel files, or any additional information. The attachments support revision control and multiple versions of the same document are saved in the platform. This is very useful to keep multiple versions of OEM monthly reports or files.
Below each plot is a table of the data. Here users can view the data points, export the data to a CSV or Excel file, add notes, and attach files. This is common amongst all tabs. Notes can be made for each of the turbines separately or at the site level. For example, the user can note that the discrepancy was found to be because of missing raw data or alarms for a particular device. The attachments can also be added at the individual device level. This feature is very useful to document any discrepancies, adjustments, or justifications.

