Table of contents Markets Updated over a week ago Table of contents
The Markets module is designed to integrate ISO market data into the Renewable Suite. The Market's module today enables this integration by tapping into a 3rd party's APIs to query this data. Often Renewable Suite customers are already subscribed to vendor's such as Tenaska who are aggregating both public ISO data as well as asset specific privileged owner data related to scheduled and settlement information. By integrating pricing data, settled production, scheduled bids, and curtailment numbers, more accurate revenue calculations, automation of settlement reports, and increased visibility of performance relative to revenue opportunity can be surfaced through the Renewable Suite.
Subscribing the Markets Module
When the Markets module is subscribed, a user password and login are required. The customer's password will be encrypted for secure storage in the Renewable Suite without enabling users to access the username/password. This is a one time setup that will happen in coordination with SparkCognition team. If passwords change, please alert SparkCognition team to update the information using the help button in the bottom left of the platform.
Configuring Endpoints
There are two tabs in the Markets module - Tenaska and Configuration. The Tenaska tab queries data per configured API endpoint. These endpoints, corresponding to the 3rd party endpoints, are enabled in the Configurations tab.
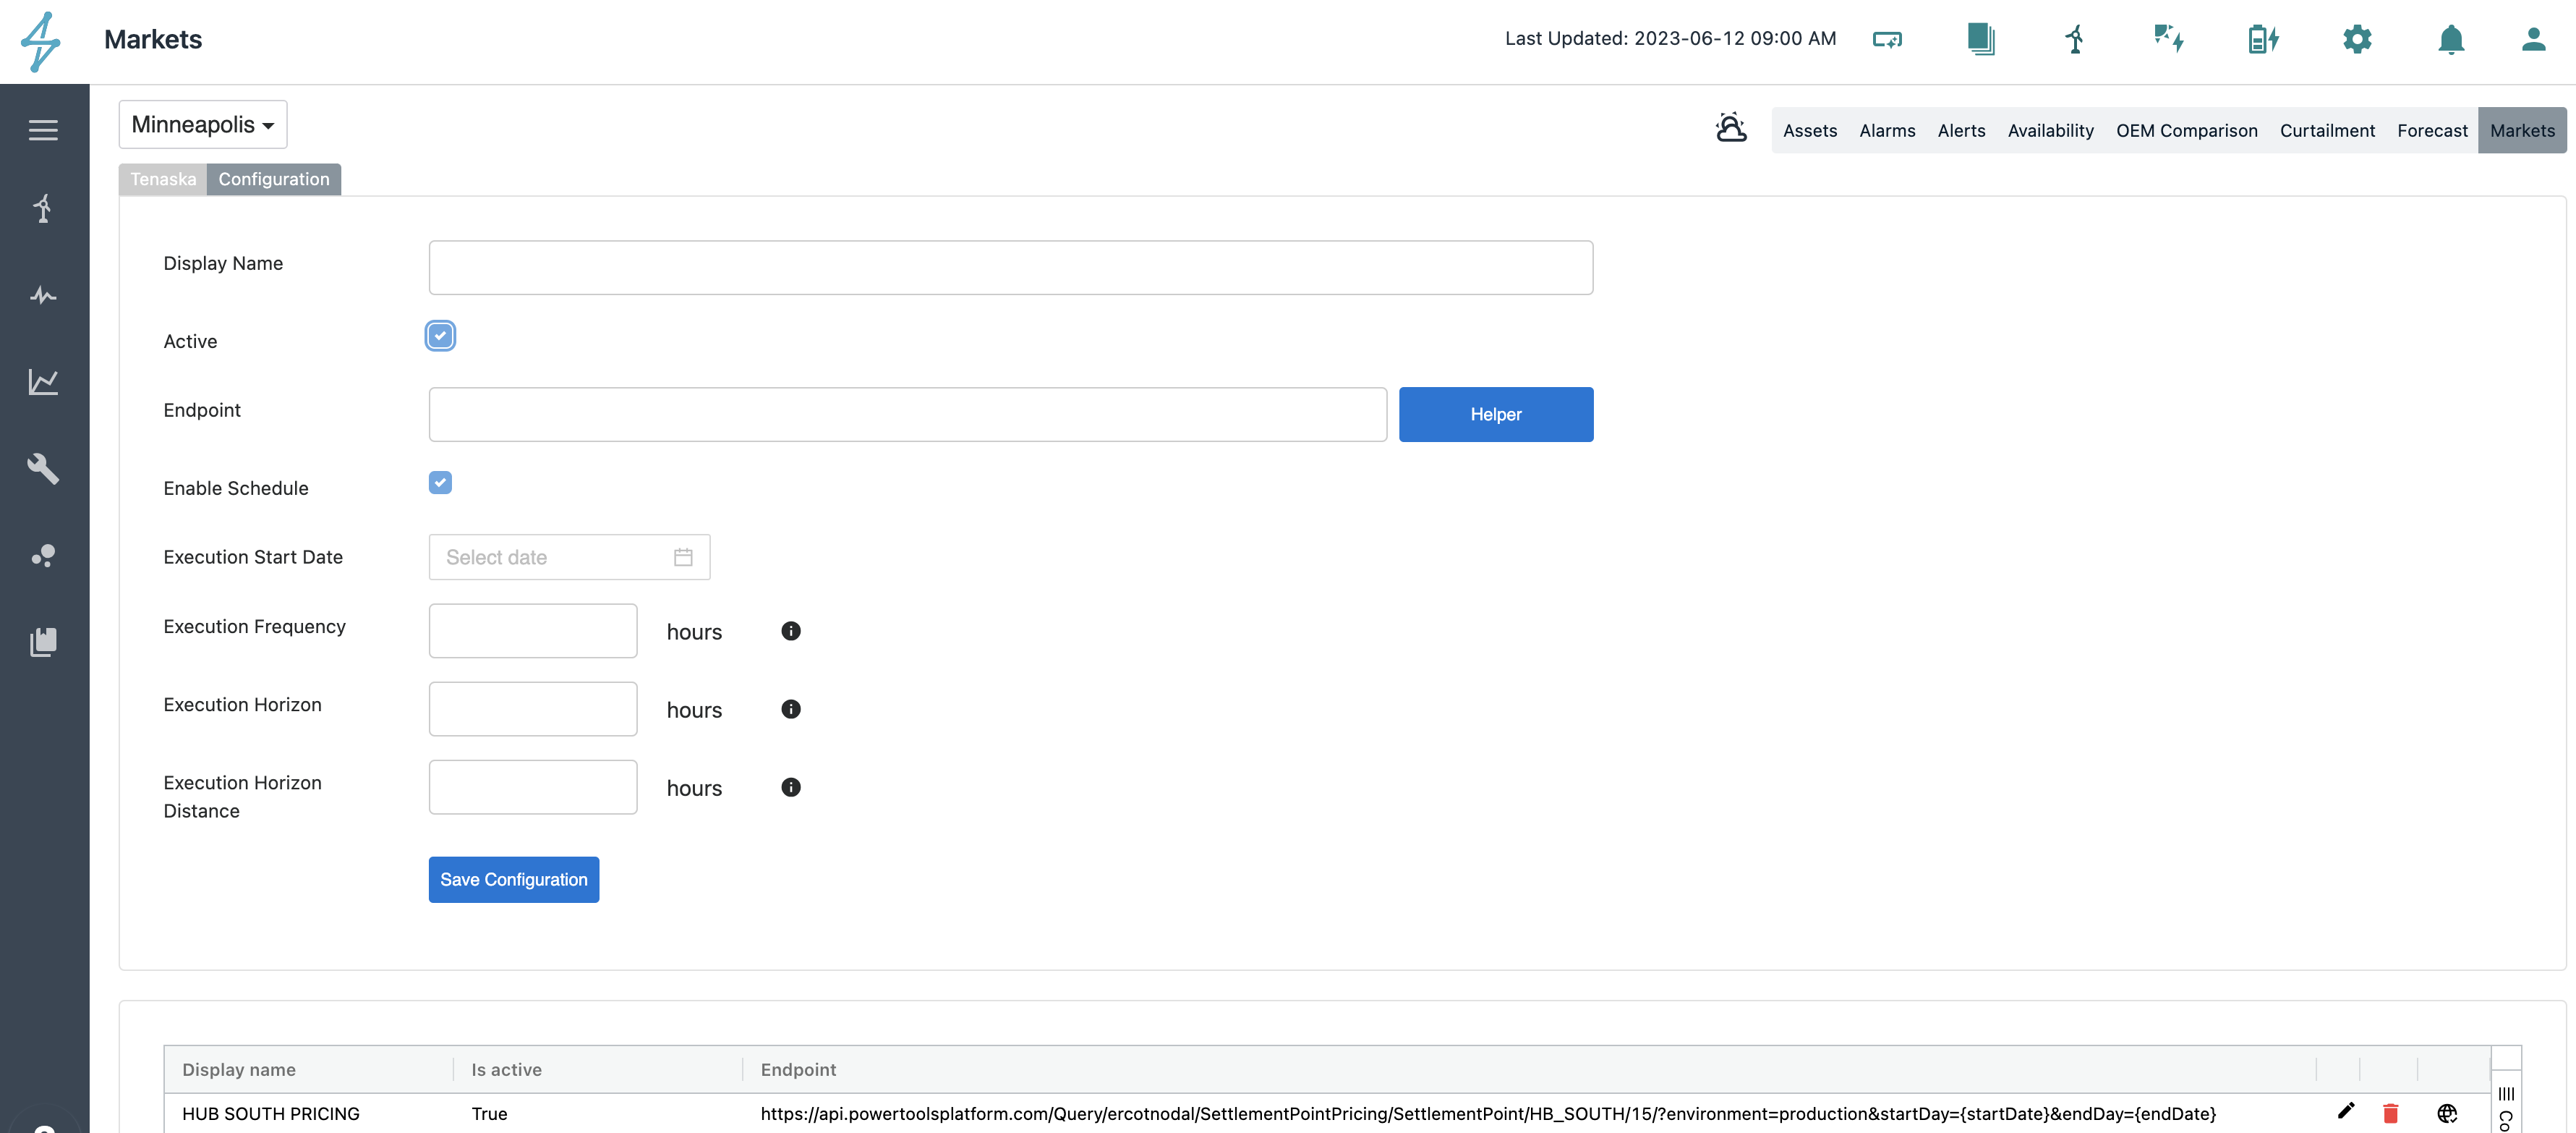
To set up an endpoint, you must save a configuration of the that endpoint, give it a display name, and label it as active in the form below.

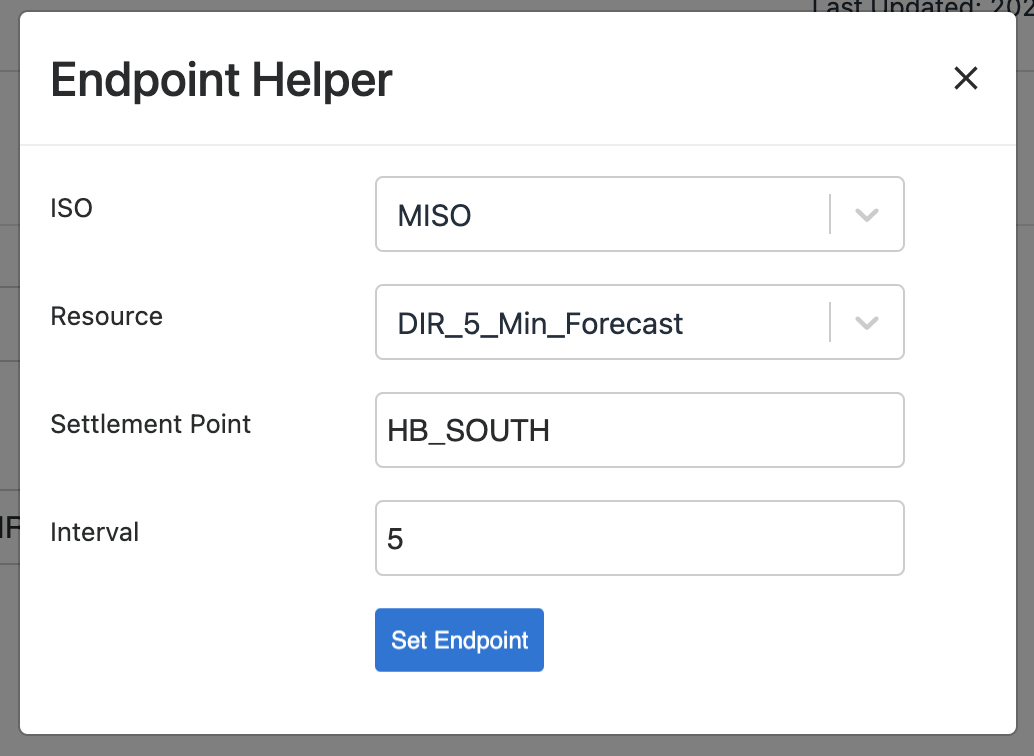
The endpoints correspond with the 3rd party's endpoints. The Helper provides drop downs for the key information of Tenaska's API formats. You can enter the endpoints directly or use the endpoint helper.

If you enter the endpoints directly, make sure that you assign the variable "startDate" and "endDate" to the correct part of the API as those are the variables used by the Renewable Suite to pass the start end end dates.

Once an endpoint is added, you can test the endpoint you clicking on the globe symbol at the right of the row. This will ping the endpoint and let you know that it was successful or that it is an invalid endpoint. If invalid, or if you just want to change the name or deactivate, you can click the pencil edit button. The delete button will remove the endpoint all together. The active checkbox will enable you to still have the endpoint setup, but it just wont be viewable in the drop down on the Tenaska tab or the scheduled query will be paused.

Querying Market Data
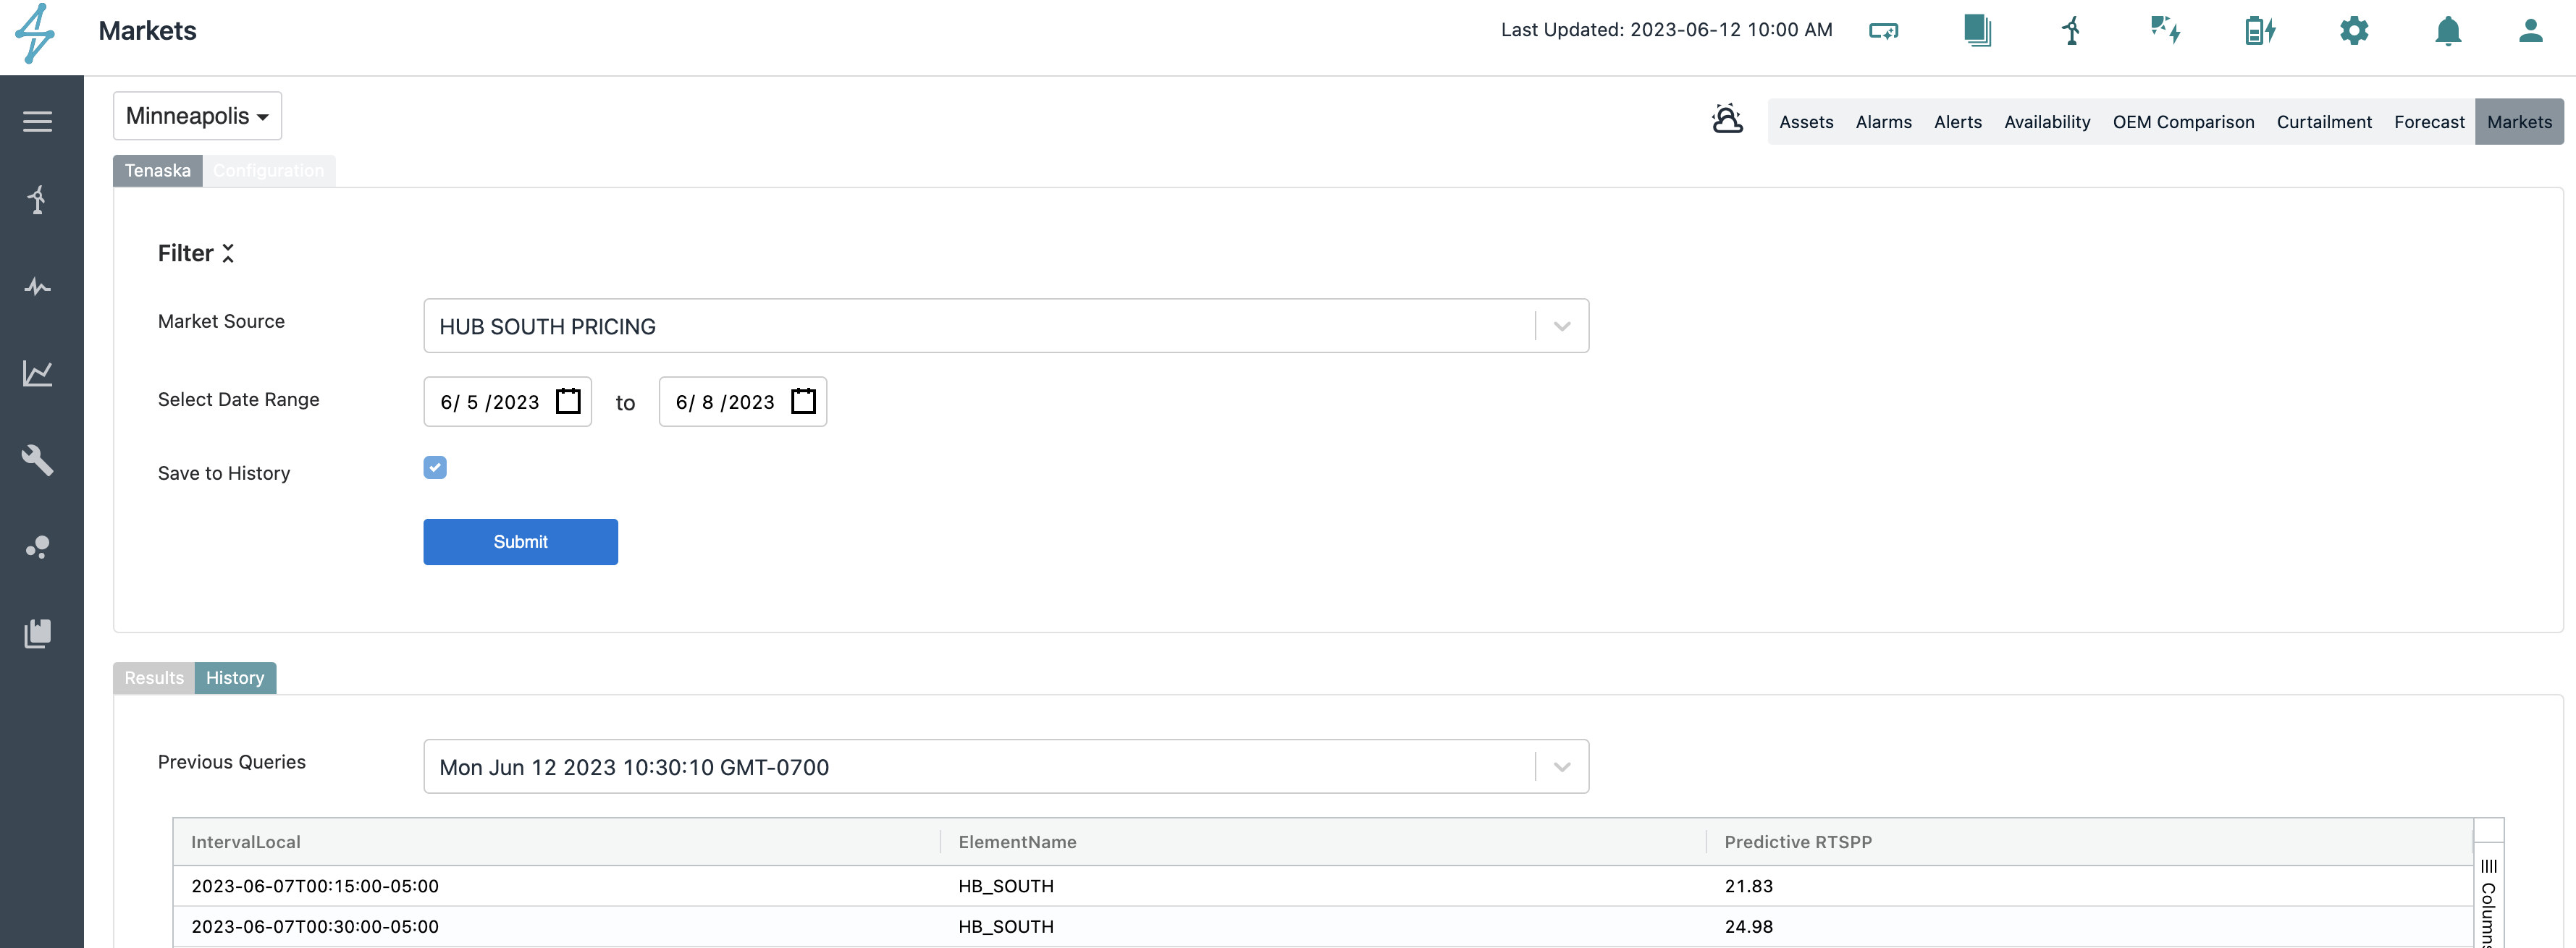
Once you have an endpoint configured, you can now reference it in the "Market Source" drop down of the Tenaska tab. From here you can submit the API call for a specified date range for it to appear below in the results table. Note that the start and end dates are treated in the way the 3rd party's API expects - so for Tenaska, the dates are not inclusive. This means that if you query 6/1 - 6/2 you will get 24 hours from 6/1 00:00:00 through 6/2 00:00:00. If you query 6/1 - 6/1, you will not get any data.

The results returns the full table from the 3rd party API - sometimes multiple columns, multiple assets and various tables are for hourly, 15min, or 5min intervals. The table can always be sorted, filtered, pinned, or hide columns similar to elsewhere in the Renewable Suite using left and right clicking on the column headers. This can be helpful to quickly see lowest/highest pricing, filter for only a specific asset, or hide columns that are not applicable. You can also right click on the table to download the data to Excel. It is typical for Tenaska to return the timestamp in local time. The -05:00 in the example below specifies the time zone but the hour is already in that time zone. The API also returns the information in whatever way the 3rd party handles daylight savings. For Tenaska MISO for example, changes from -05:00 to -6:00 and back rather than having a 23 and 25 hour day for daylight savings. Within this module, we are respecting the 3rd party data source.

Updating Market Data & Saving Historical Data Pulls
ISO data has the ability to be updated, and thus causing settlement updates and refreshing needed of the data pulled. One challenge with data source like Tenaska is that the data updates but the prior version was not saved for reference of the difference between the changes. The Market's module enables you to save a one query to the history table as a one off entry and also to schedule reoccurring runs of API endpoints so that this data is available for comparisons.
To save a particular query's results, check the "save to history" checkbox when you submit the query. If your query has a prior query that overlaps with any portion of the date range that you are querying now, it will appear as an entry in the drop down. You can export this data by right clicking on the table or sort/filter by right/left clicking on the column headers. Flip between results and history tab to compare on the UI between the current query and the historical query.

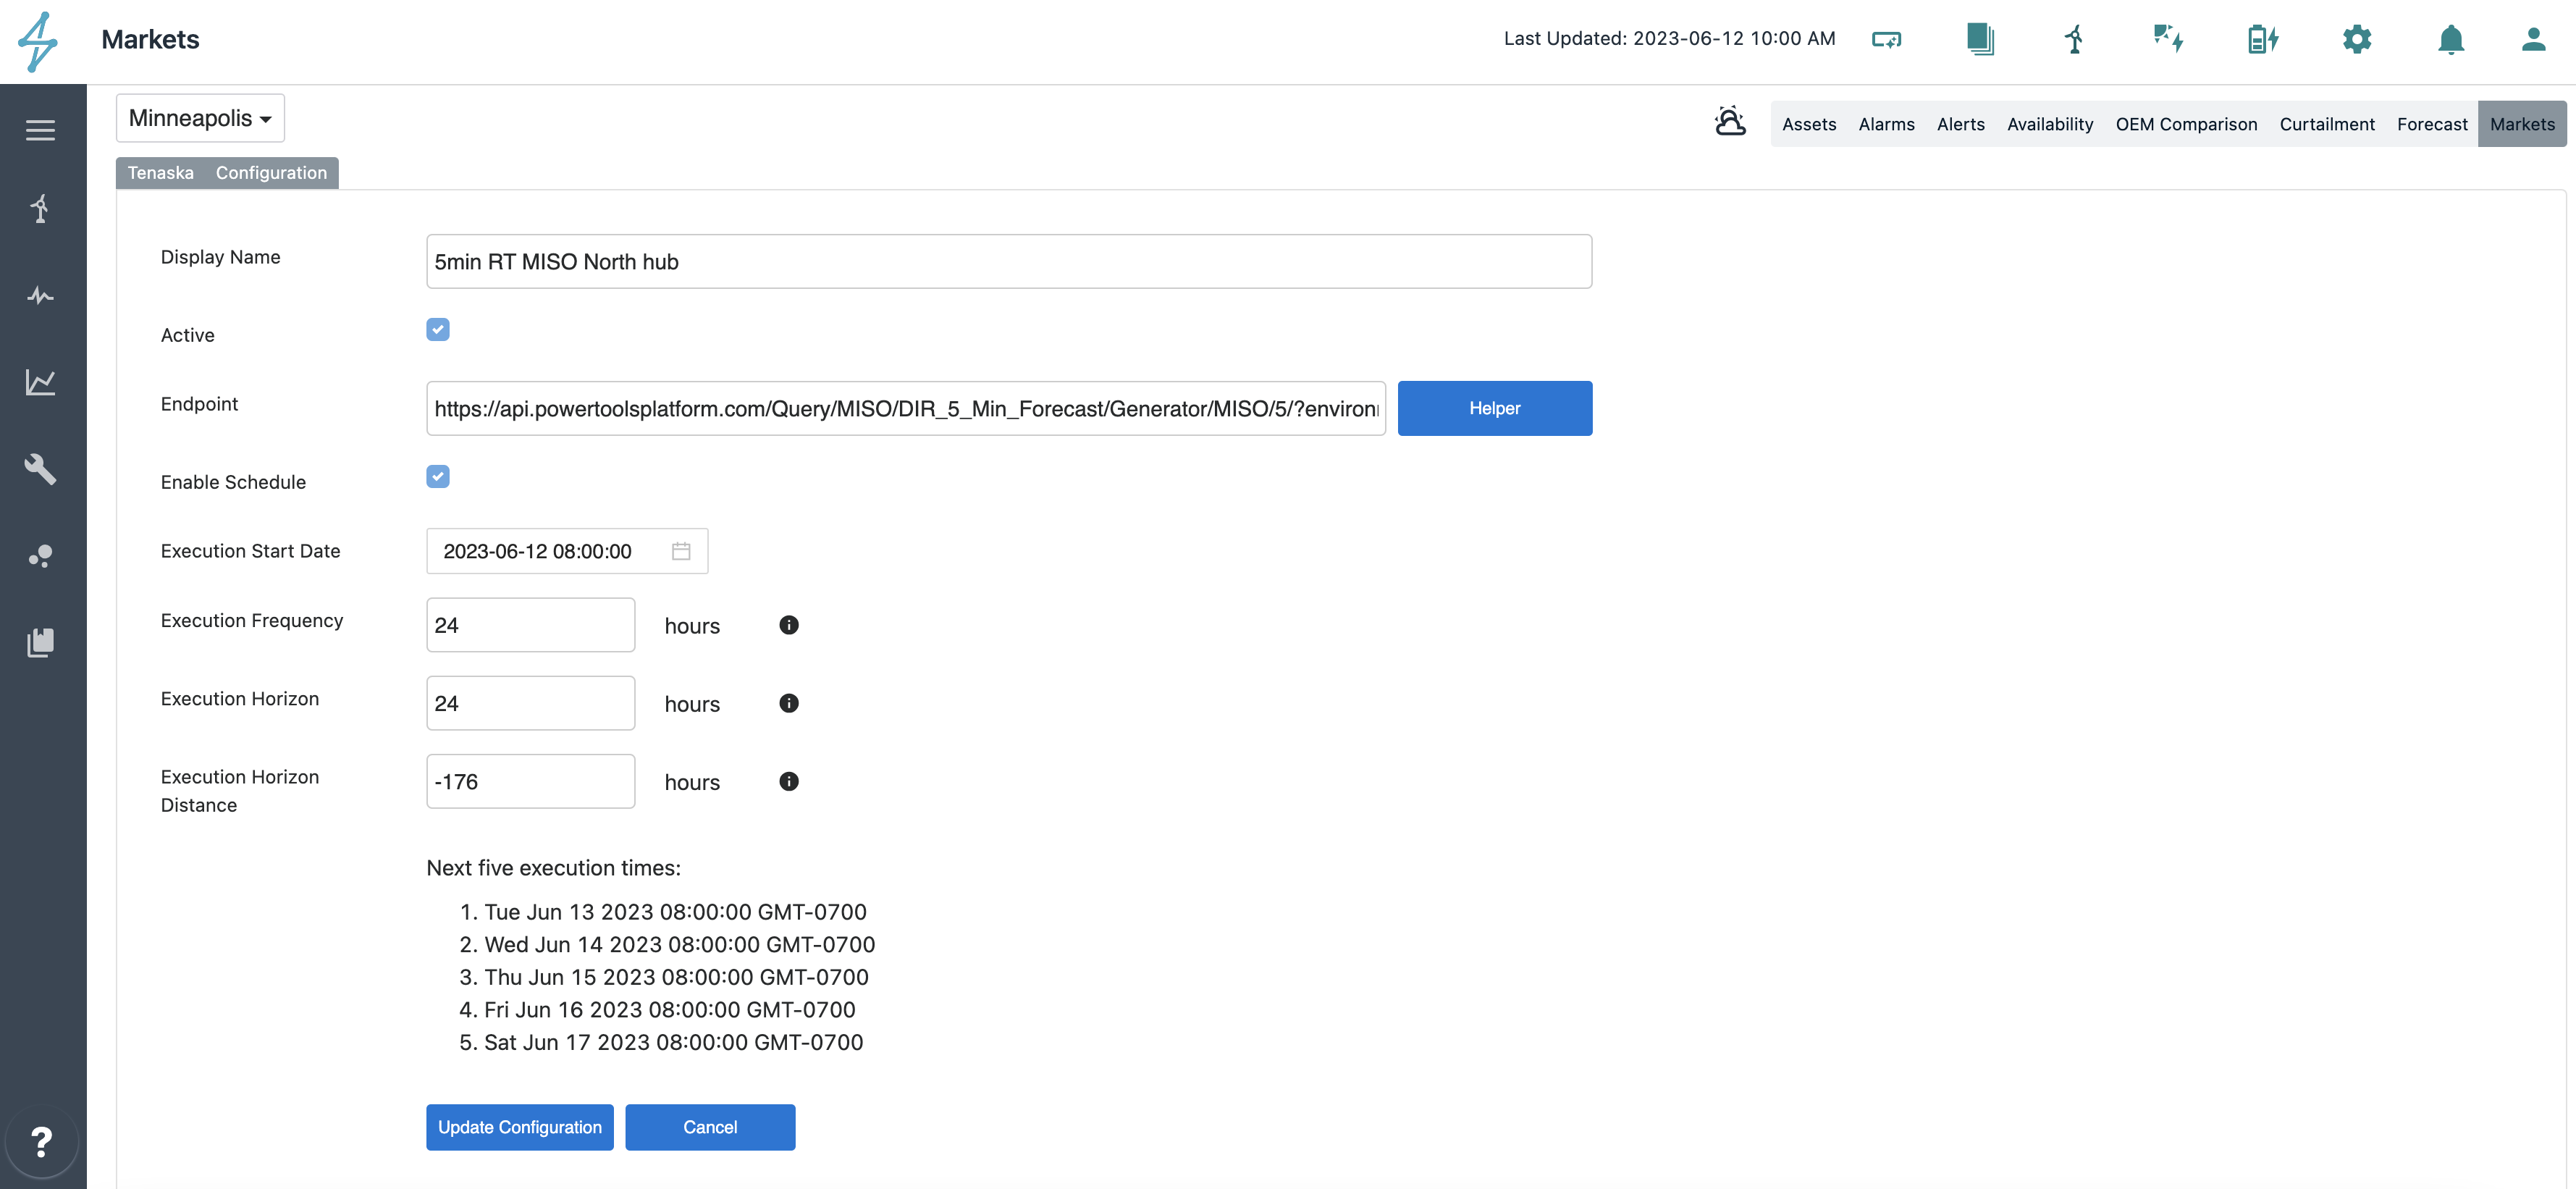
If you are looking for periodic data pulls, these can be scheduled per endpoint when configuring the endpoint. On the configuration tab, you can check the "Enable Schedule" checkbox which will prompt you to setup the frequency, horizon, and start date / horizon distance. Note that schedules will only run for the current date forward, assigning a start date to historical dates will not be able to populate historical queries of data. You can assign execution horizon distances that are negative to mean to query back in time from the date/time that the query is executed on.

MISO for example, updates pricing and settled generation on T-0, T-7, T-14, T-55, and T-105 days. They typically update after the day is fully passed. Let's say you are looking to schedule the RT prices table to save data at each of these instances. You would set up 5 schedules for the same endpoint:
-
execute starting 6/1/2023 (day that we enabled this schedule) at 08:00:00 (8am for a buffer on data being complete from day prior) for 24 hours execution frequency (query this every day at 4am) for a horizon of 24 hours for a date starting -8 hours before the date / time scheduled (yesterday). This would pull T-0 data for the yesterday, each day.
-
execute starting 6/1/2023 (day that we enabled this schedule) at 08:00:00 (8am for a buffer on data being complete from day prior) for 24 hours execution frequency (query this every day at 4am) for a horizon of 24 hours for a date starting -176 hours before the date / time scheduled (7 days prior). This would pull T-7 data for the now 7th day in the past, each day.
-
etc. for T-14, T-55, T-105
execute starting 6/1/2023 (day that we enabled this schedule) at 08:00:00 (8am for a buffer on data being complete from day prior) for 24 hours execution frequency (query this every day at 4am) for a horizon of 24 hours for a date starting -8 hours before the date / time scheduled (yesterday). This would pull T-0 data for the yesterday, each day.
execute starting 6/1/2023 (day that we enabled this schedule) at 08:00:00 (8am for a buffer on data being complete from day prior) for 24 hours execution frequency (query this every day at 4am) for a horizon of 24 hours for a date starting -176 hours before the date / time scheduled (7 days prior). This would pull T-7 data for the now 7th day in the past, each day.
etc. for T-14, T-55, T-105
Once those schedules have run for a while, if you were to to query the API for a full 30 day month, you would have 150 history tables each equating to a T-0/T-7 etc. for the day in question.
When this data later becomes accessible in plotting/analyzing along side of other performance and weather data, or available through SparkCognition APIs, the Renewable Suite will translate it to align tie zones correctly and consistent with Renewable Suite configured time zones and methodologies, and aggregate typical T-0/T-7 etc. data pulls into a time series.
