Table of contents Forecast Updated over a week ago Table of contents
The Forecast module in the Renewables Suite platform is useful for users or asset owners who have any forecasting requirements or would like to better plan their maintenance events.
Accessing the Forecast module
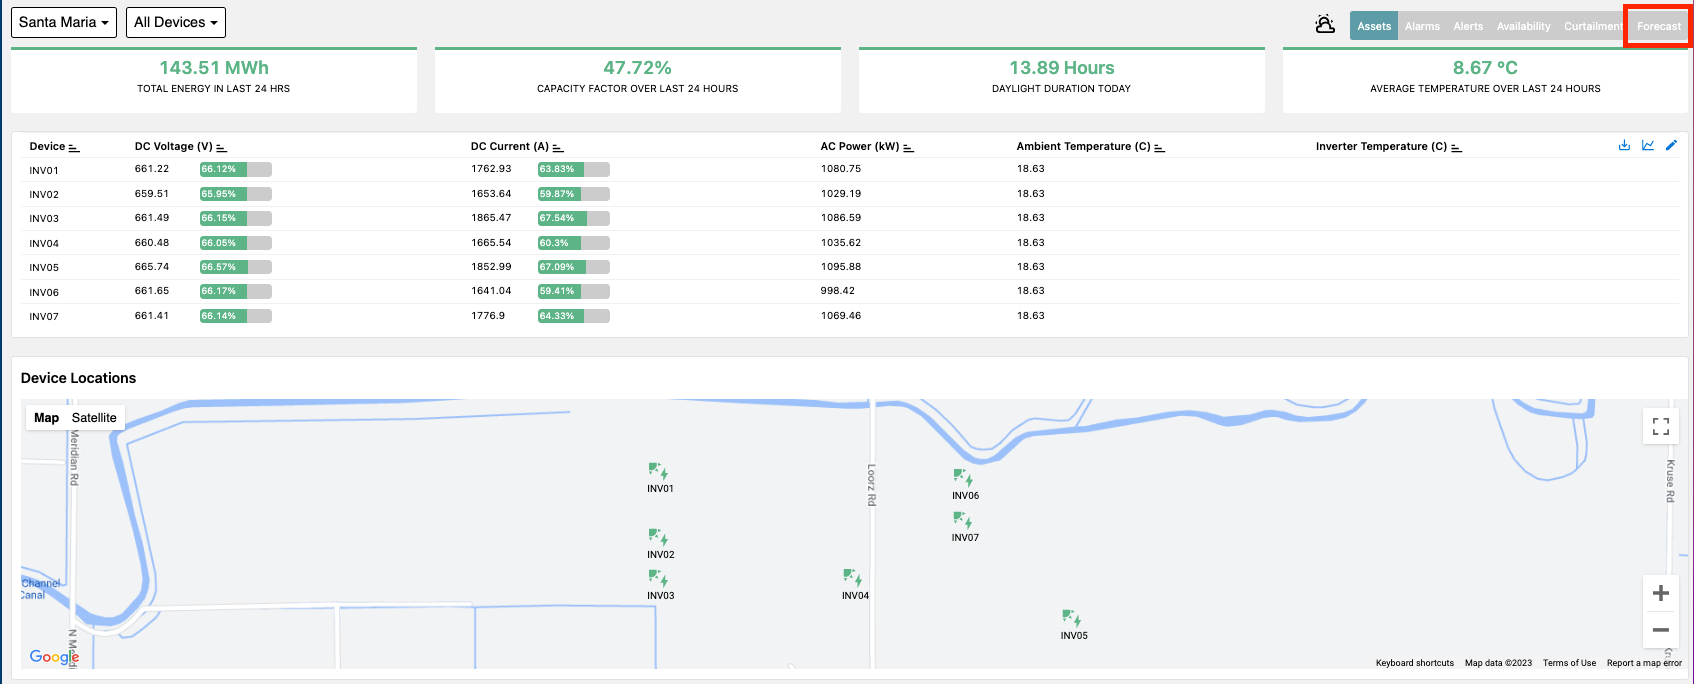
This module can be found on the Asset Overview page on the top right tab bar. Selecting this tab will bring you to the Forecast module overview page.

Using the Forecast Module
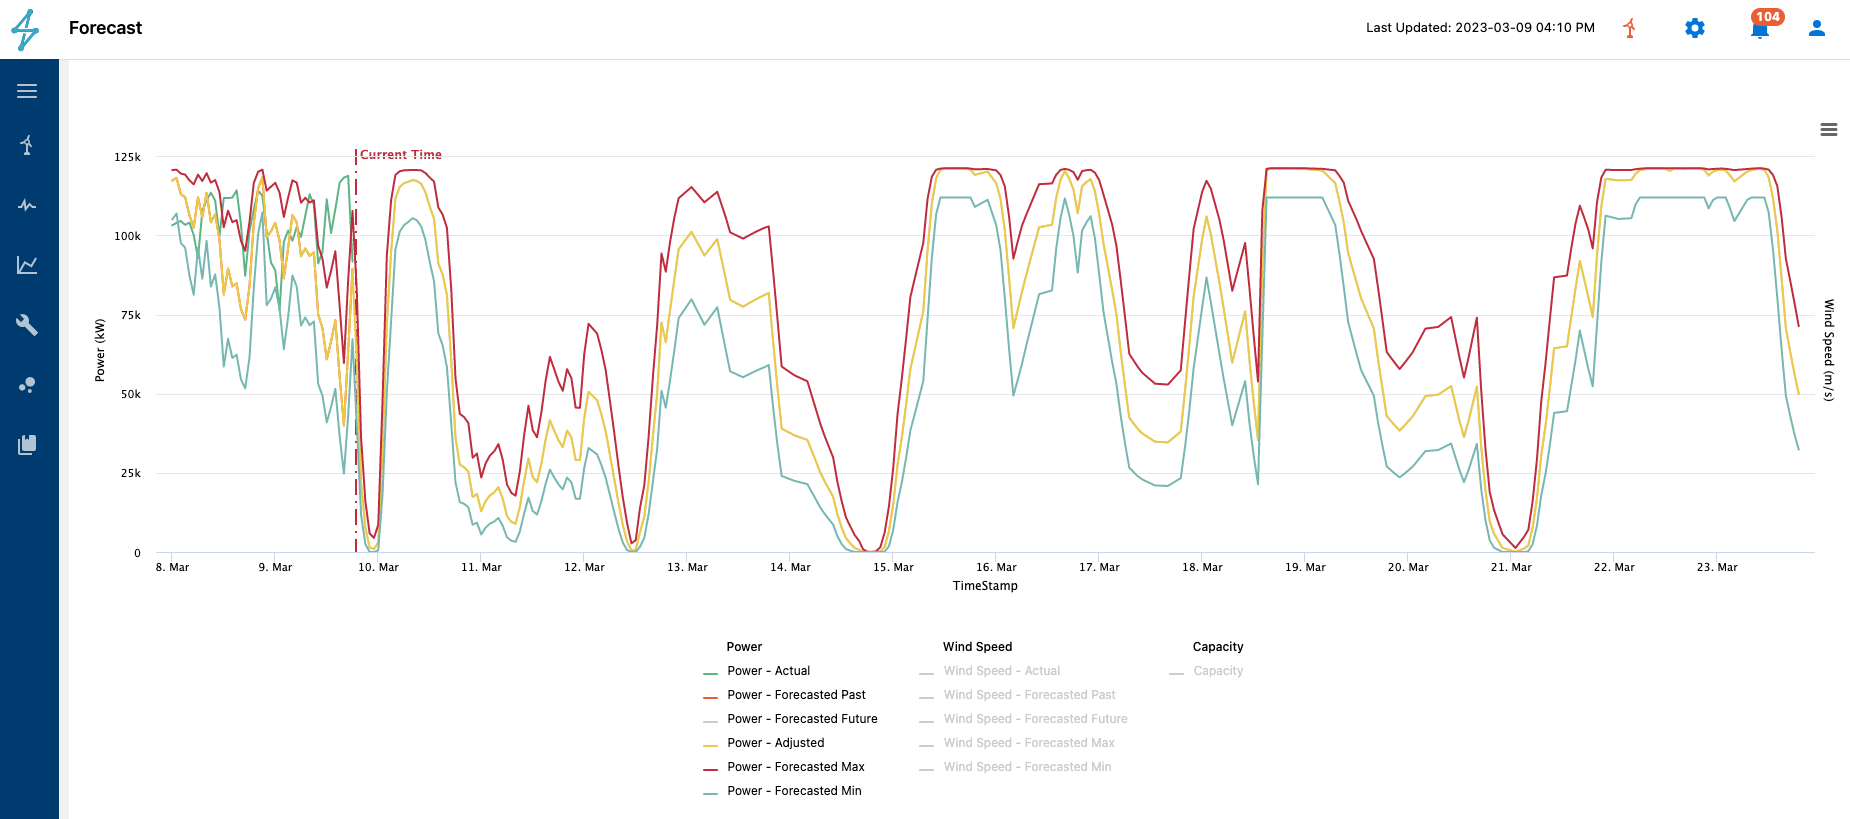
Once in the Forecast module, users can select a forecast algorithm from the drop-down menu if one has been setup for that specific asset.

Selecting the algorithm will automatically bring up a plot based on the algorithm's forecast criteria. In the case above it is a week ahead on an hourly basis. Users will also see a comparison of the previous day's forecasted values compared to actual observed values.
Trends can be added or removed from the plot by selecting and deselecting them below the plot in the plot legend.
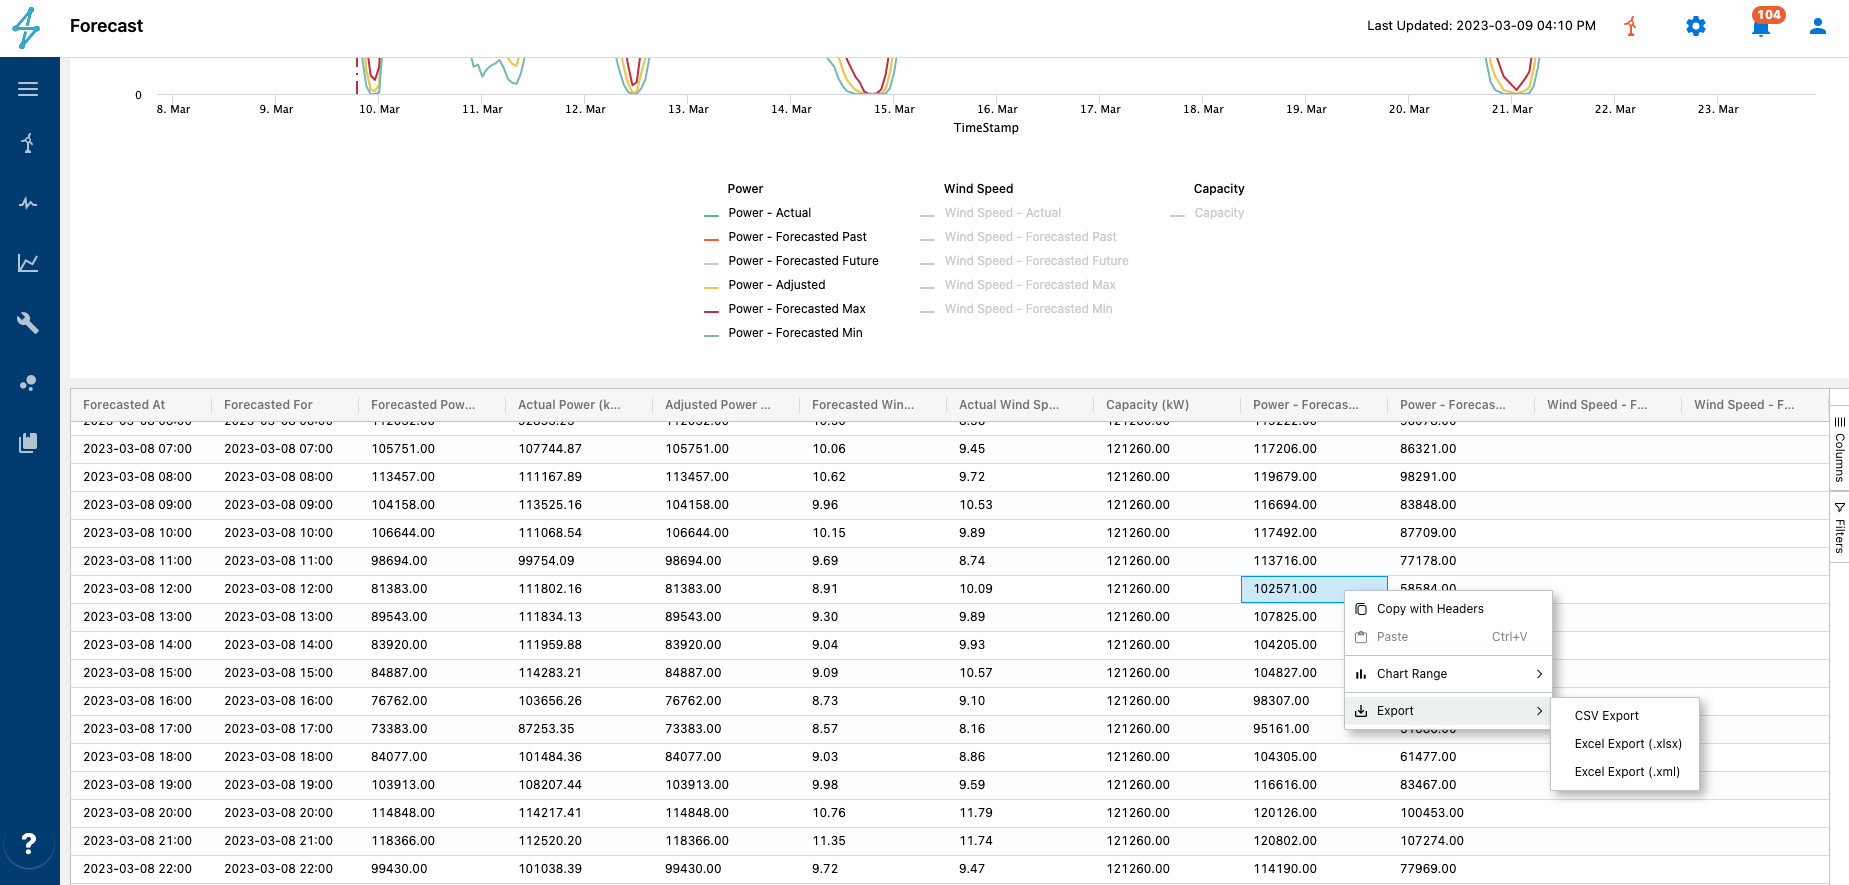
Below the plot, there is a table filled with the actual forecasted values and actual values if currently available. Like all of our tables in the Renewables Suite platform, right-clicking any cell brings up a menu of options, including exporting options.

Forecast History
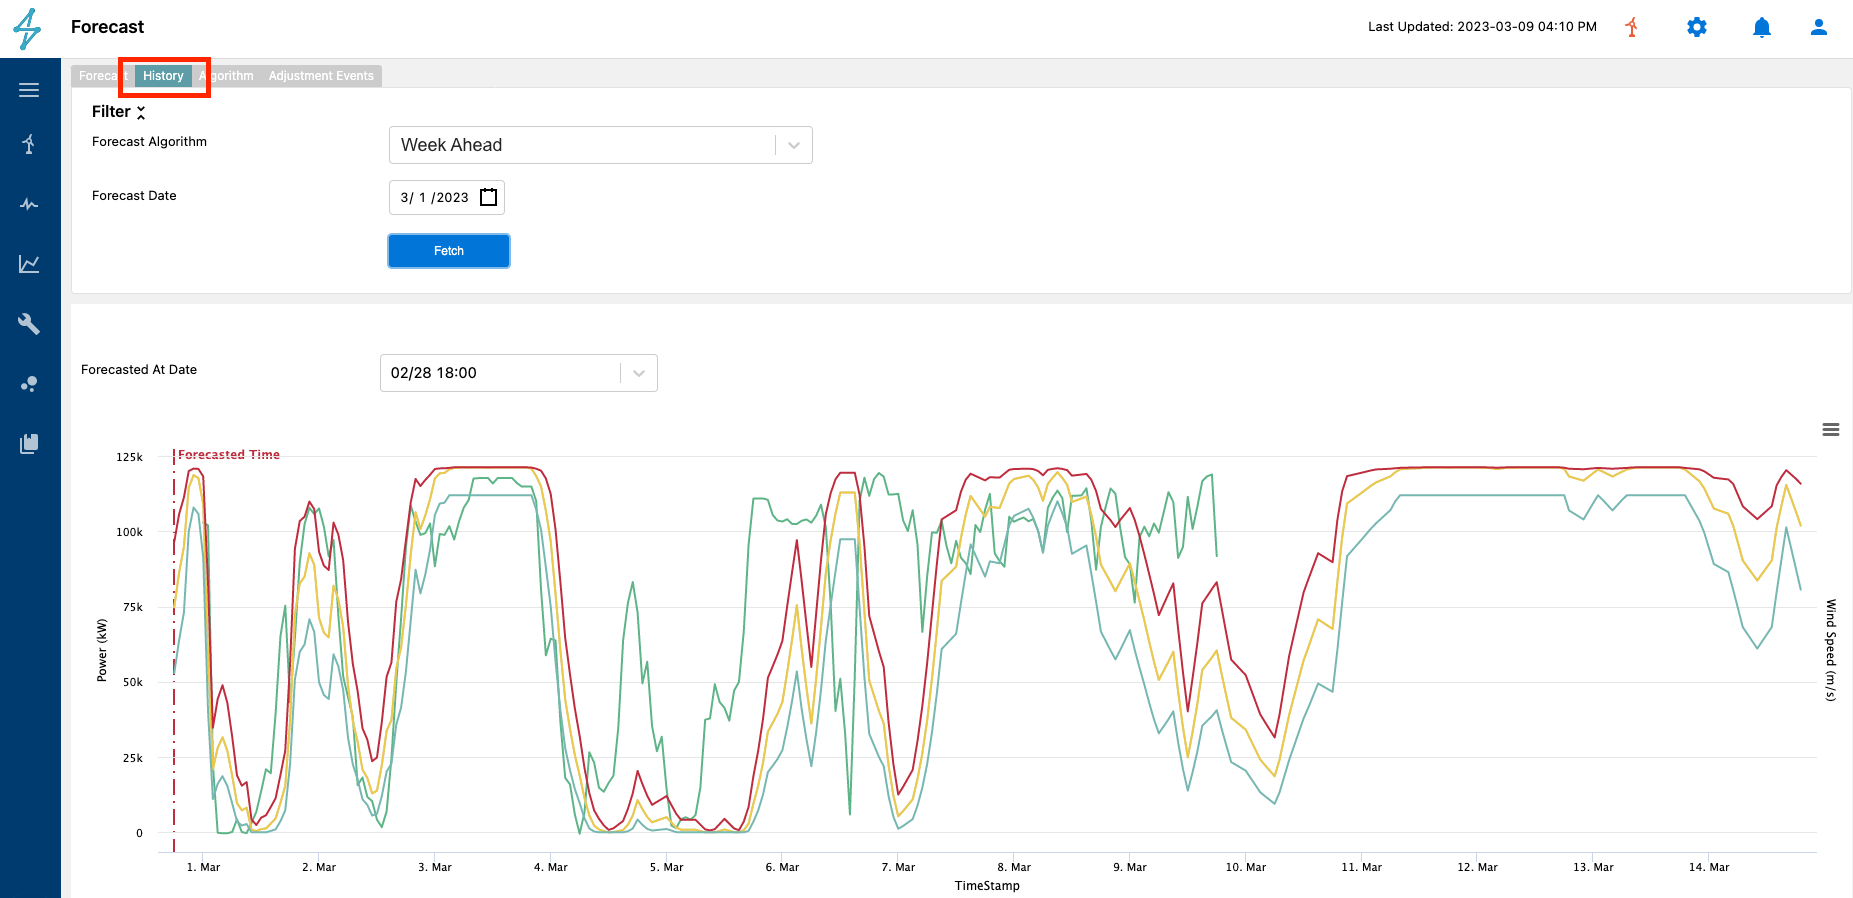
Users can see historical forecasts by going to the History tab of the Forecast module. Here users can select the desired algorithm and date for viewing the historical forecast. This is helpful for viewing historical forecast prediction accuracy.

Similar to the Forecast main overview there is a plot of the data as well as a table below the plot where users can view and export the data for the desired historical forecast and range.
