The Energy Variance (Shortfall) Table widget allows users to get a quick overview of the performance shortfall or exceedance as compared to budgeted numbers for the selected year to date. The table gives a quick overview of a comparison between Actual Production, Wind Speed, Downtime, BOP and Curtailment numbers in contrast to the Budgeted KPI's and the resulting variance between actual and budgeted numbers.
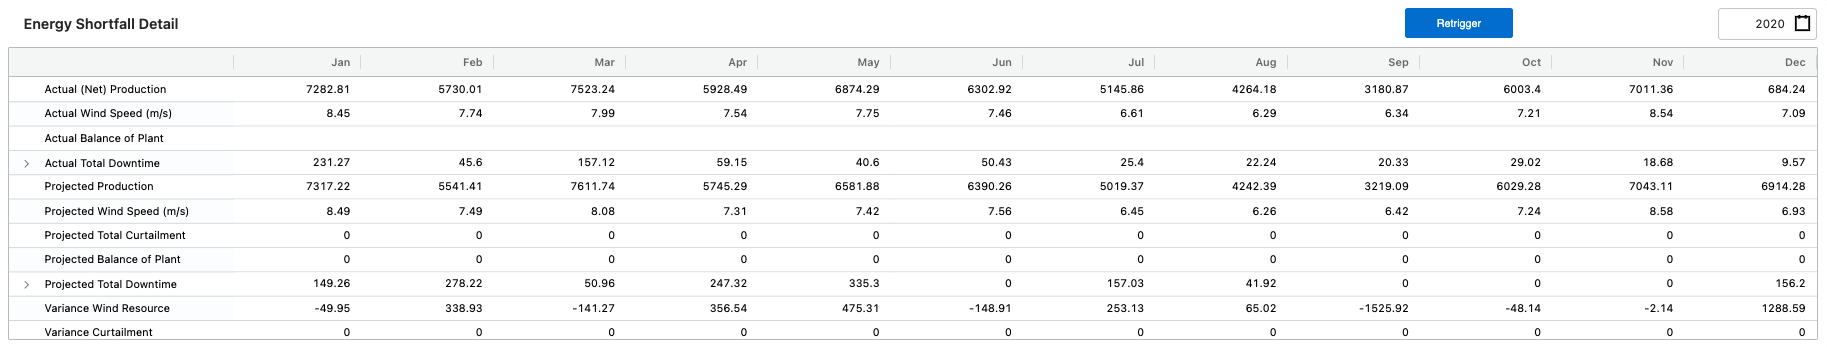
Energy Shortfall Details
Shortfall Calculations
| KPI | Calculation |
|---|---|
| Environmental Curtailment | Alarm Code classified with category Environmental or specifically denotes Environmental curtailment such as Wildlife Stop |
| Grid Curtailment | Based on Grid Curtailment specific tags |
| Service Provider Downtime |
Any downtime with Contractual Availability = NO |
| Balance of Plant | Any downtime with category = 'Balance of Plant' |
| Owner Downtime | Any downtime that is Contractual Availability = YES and NOT included in Environmental Curtailment or Balance of Plant buckets |
The Production Waterfall and Energy Loss Waterfall widgets show the details of deviations between the actual and budgeted numbers to quickly compare and contrast the actual performance of an asset with budget, and get an indicator of the causes of variations from the budgeted numbers.
The residuals include anything that is unexplained and cannot be accounted for in any of the other categories. It does not include line losses as the line losses are not included in the projected/budget numbers.
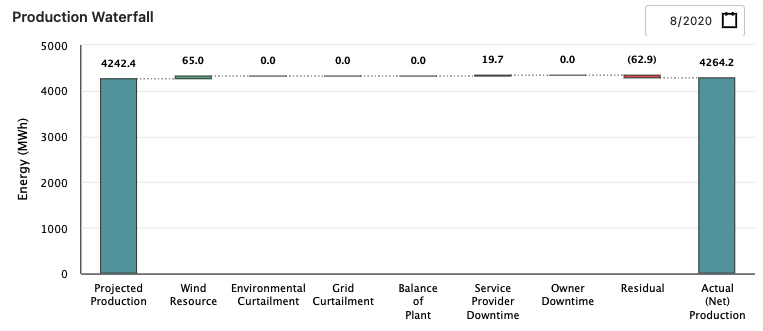
Production Waterfall
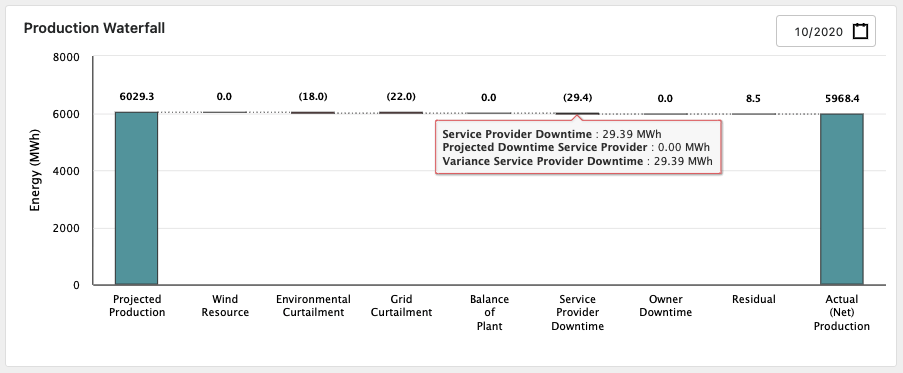
Hover to see the Actual and Projected Values
The Energy Loss Waterfall allows users to analyze the cause of losses in a certain month under various categories such as loss due to Service Provider or Owner Downtime, Balance of Plant and Curtailments.
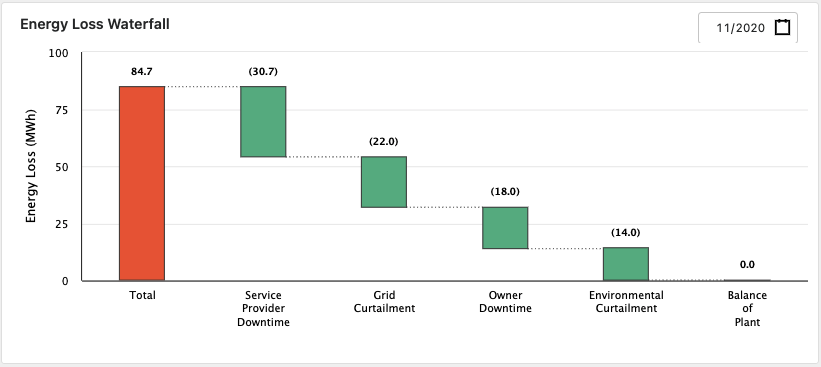
Energy Loss Waterfall