The Data Analysis is a page within the Analyze Module that allows for users to compare data from various module across the Renewable Suite in a single place. It allows you to select specific data (fields, filters, aggregation), interface (view/filter/sort) with it in table format, and provides some quick plotting tools (plot by device/date). Templates can be saved for frequent queries, for collaboration across colleagues, and for referencing in reports.
Data Analysis is unique in that you can specify your aggregation level across both devices and time period.
Aggregation Level (Site/Devices) & Select Devices allows you to select site level (similar to all devices) and device level. If you select device, you then have the option to multi-select a single, several, or group of devices.
Aggregation Level (Hourly/Daily/Monthly/Quarterly) allows you to specify how the data should be aggregated when provided. The data options queried in raw form are in 10min or hourly data and you specify when selecting the field if you want to take the sum/avg/count/min/max. Therefore if you select the Avg of Average Active Power signal as the field, and have daily selected as the aggregation, the 10min Average Active Power signal over the day (all 144 timestamps) will be averaged to provide a single daily value. If you specify Sum of Energy Production with a monthly aggregation, it will sum the energy production to provide a single monthly value.
Date Range allows you to specify the date range. This date range constrains the data used in the calculations.
❗️
Date Range & Aggregations
Be intentional in selecting the date range when using month and quarter to include the full period within that month or quarter intended. If you select month aggregation but start 1/15-6/12, you will get a table labeled with rows for month 1 through 6 but January and June will aggregate data only for the time range included. Similarly with Quarterly aggregation.
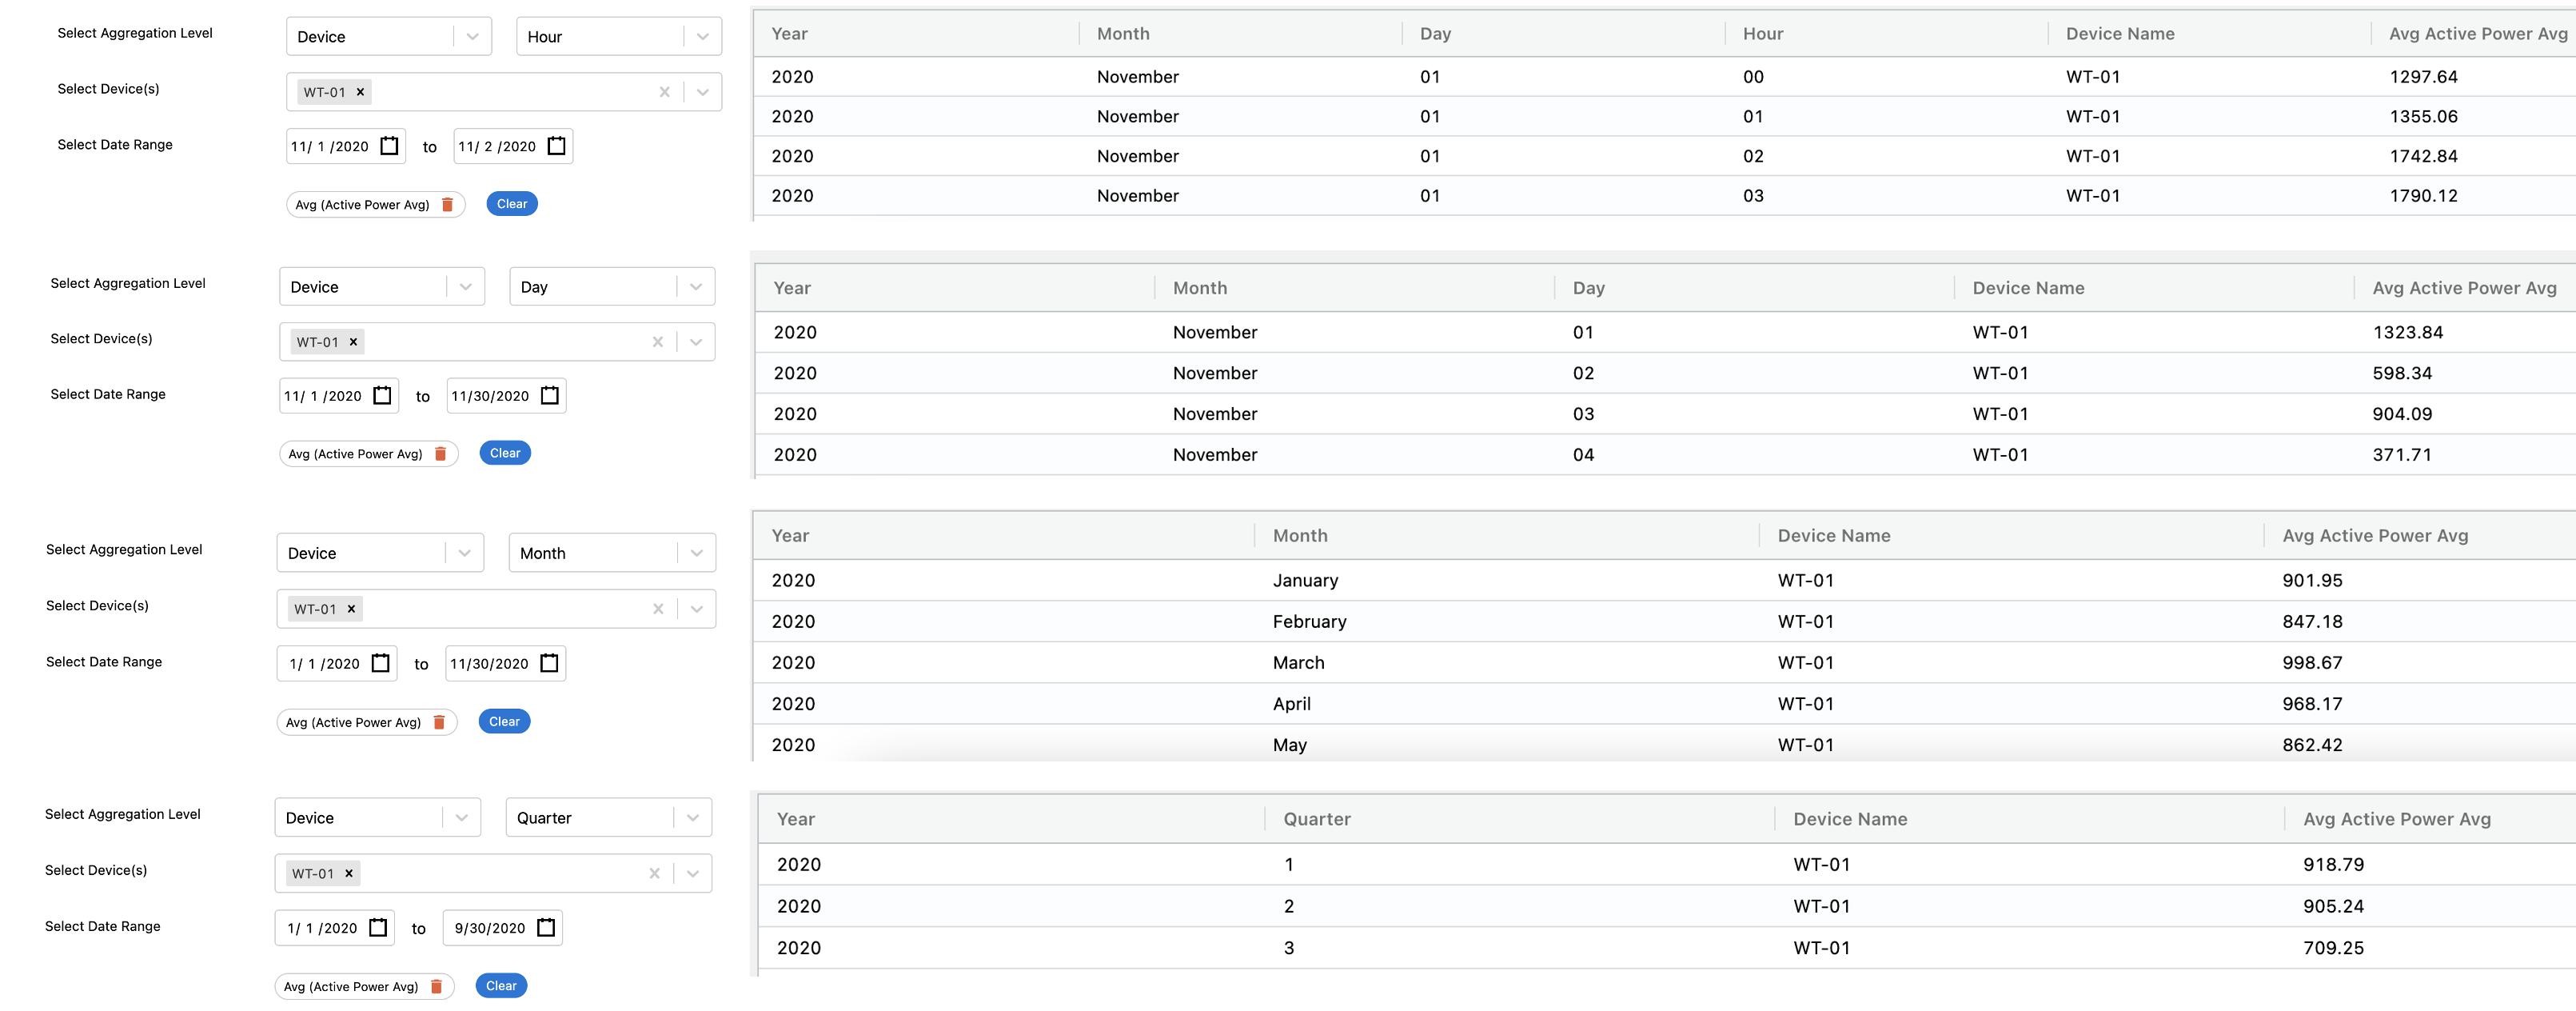
Here are examples what various aggregation levels result in
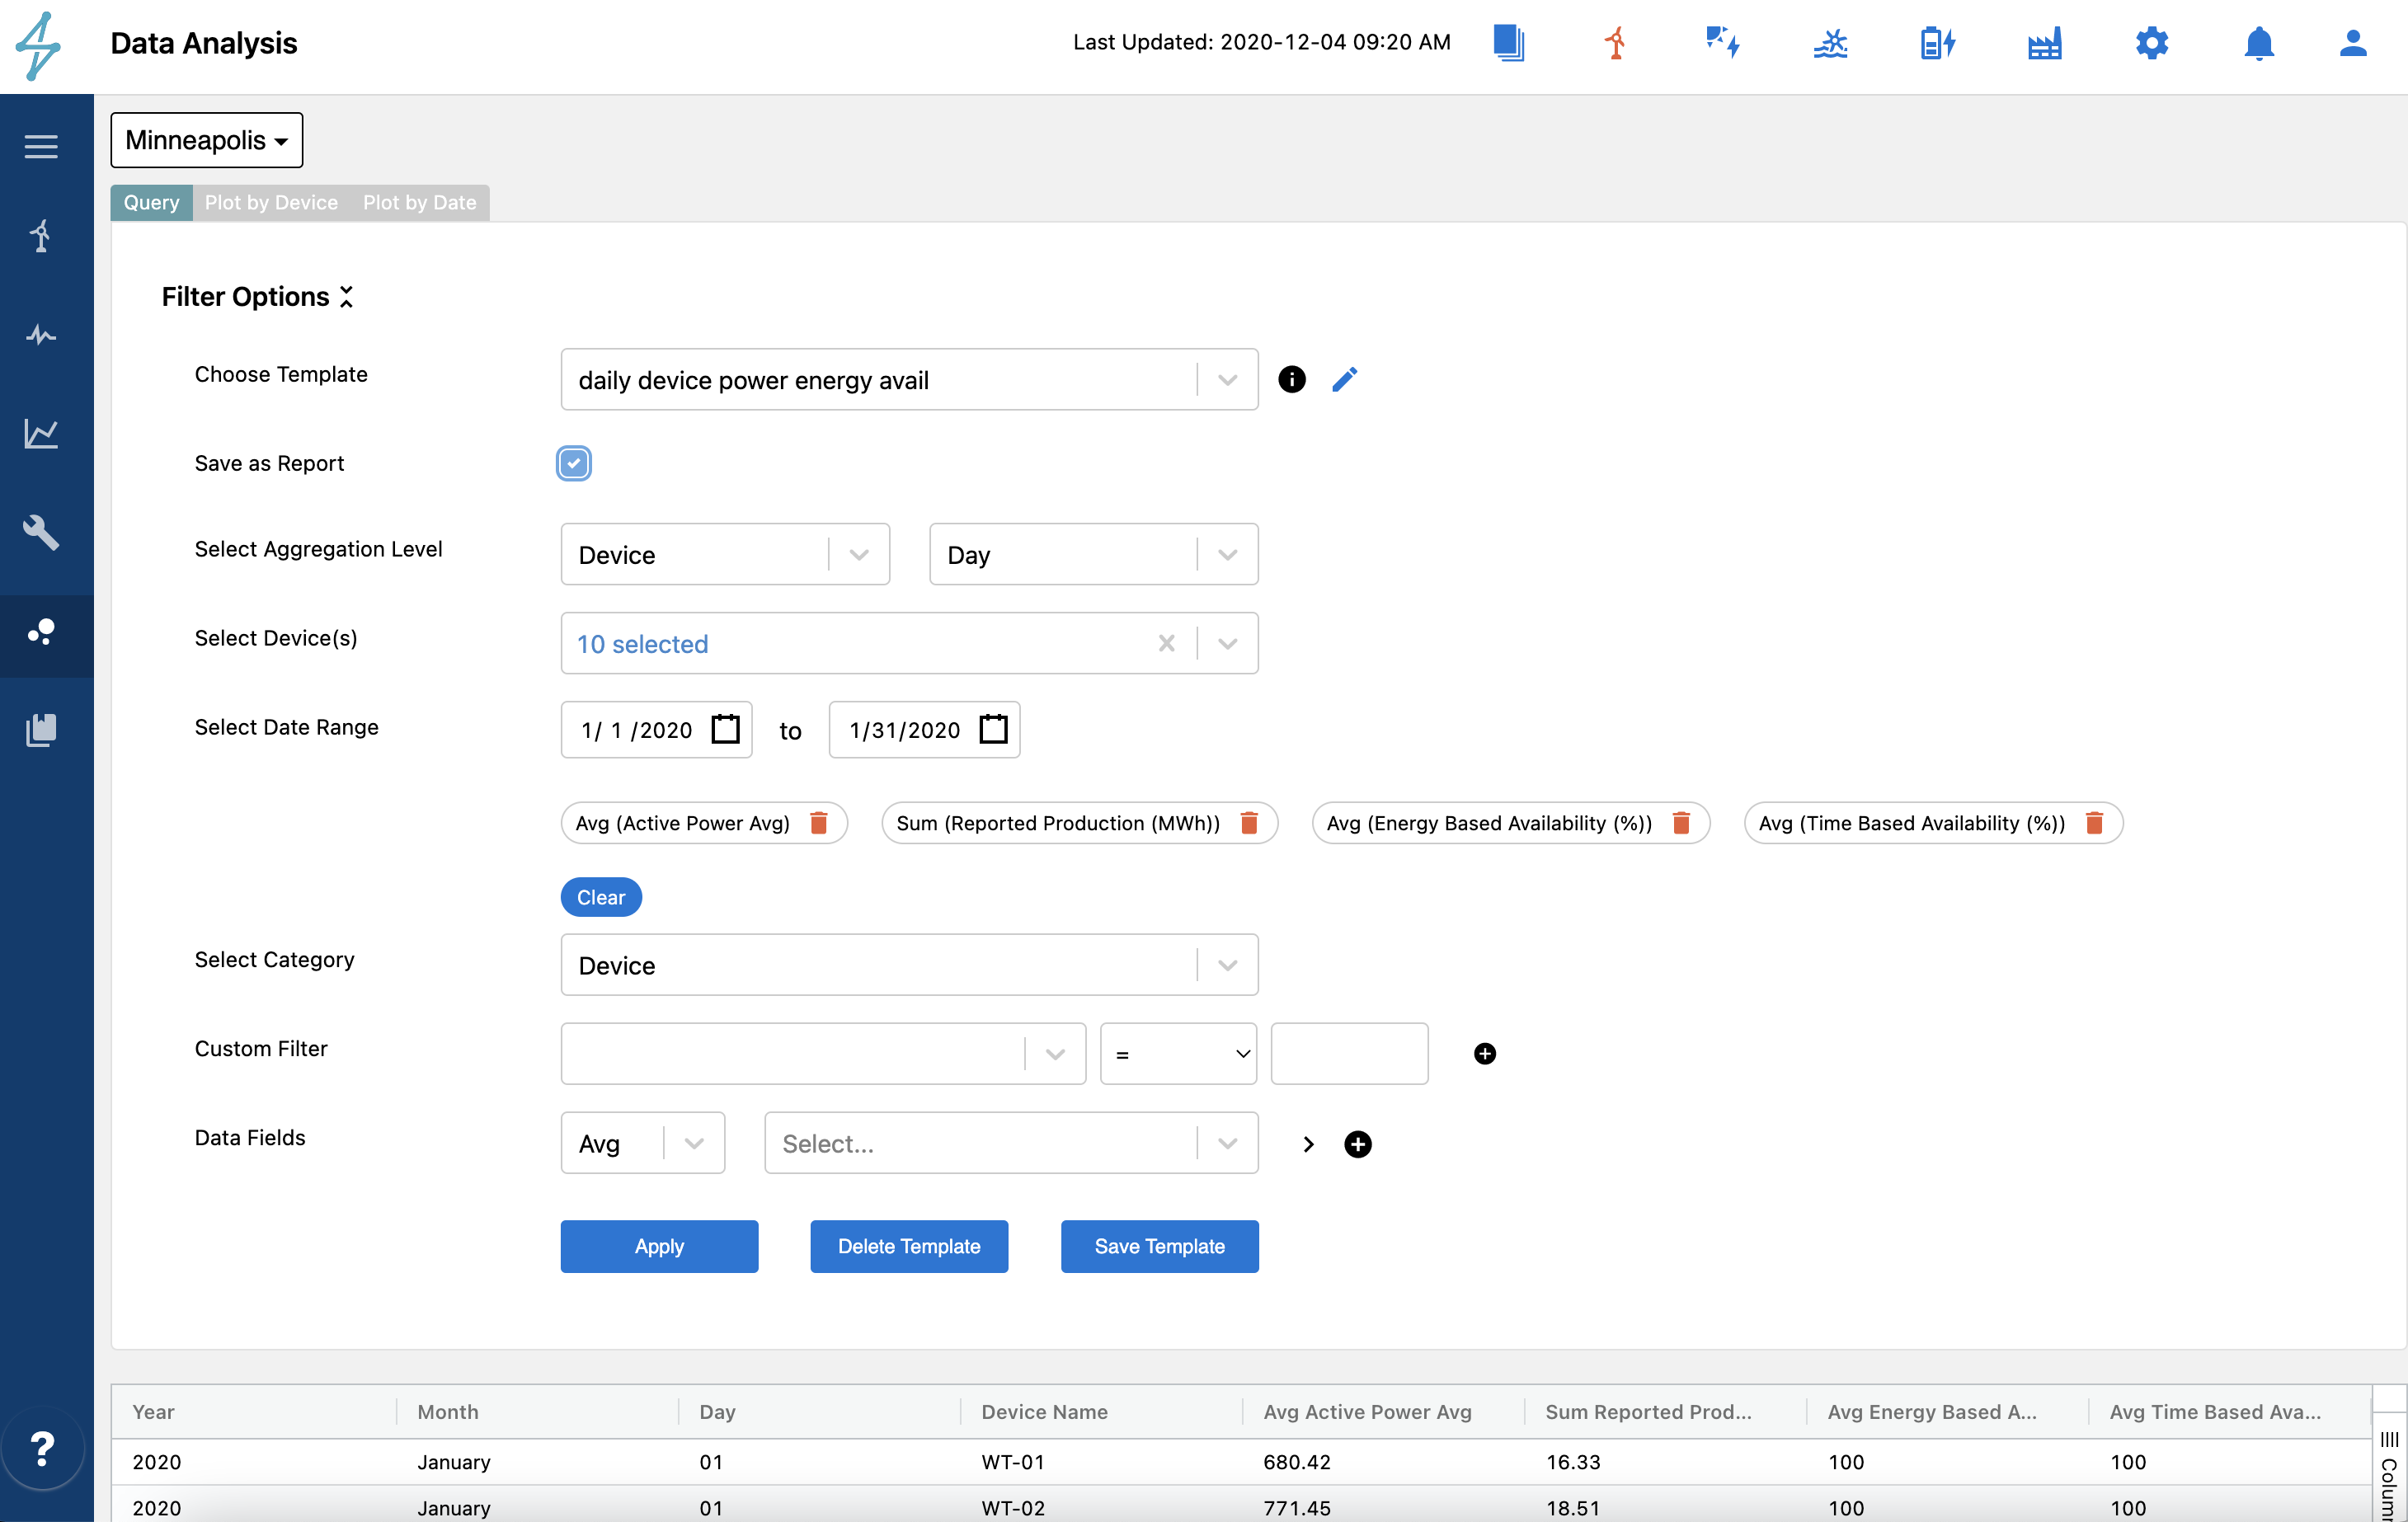
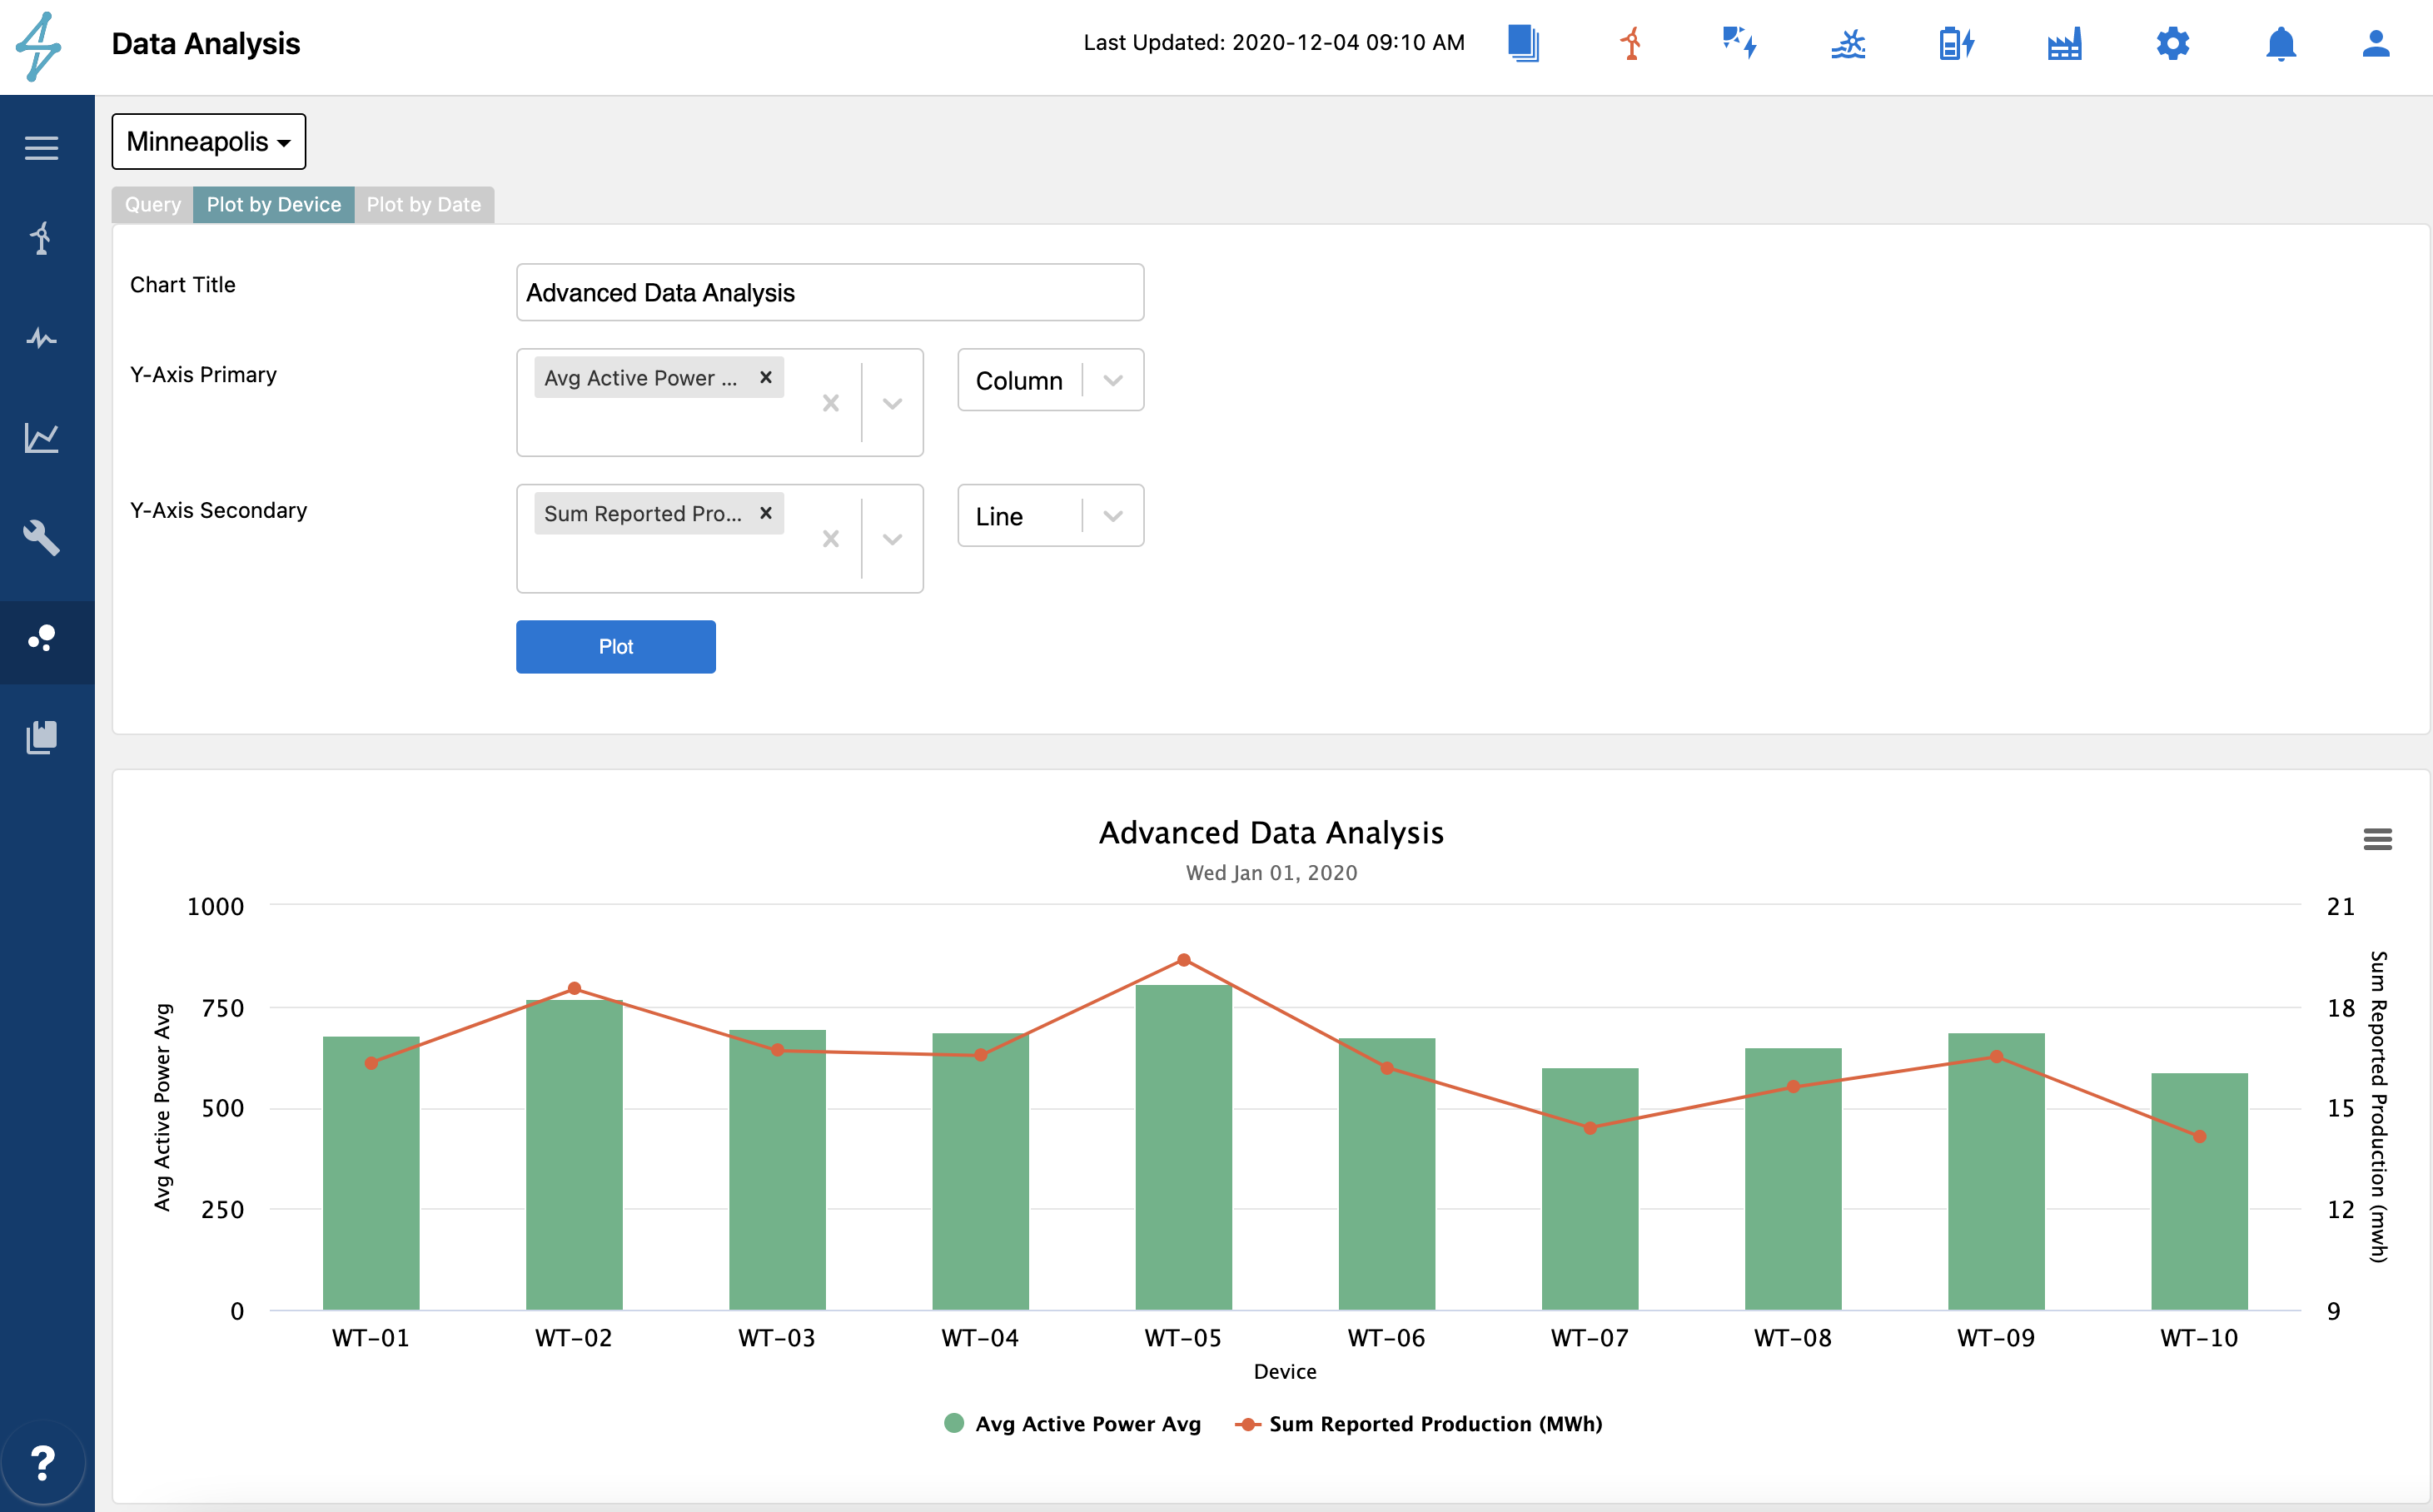
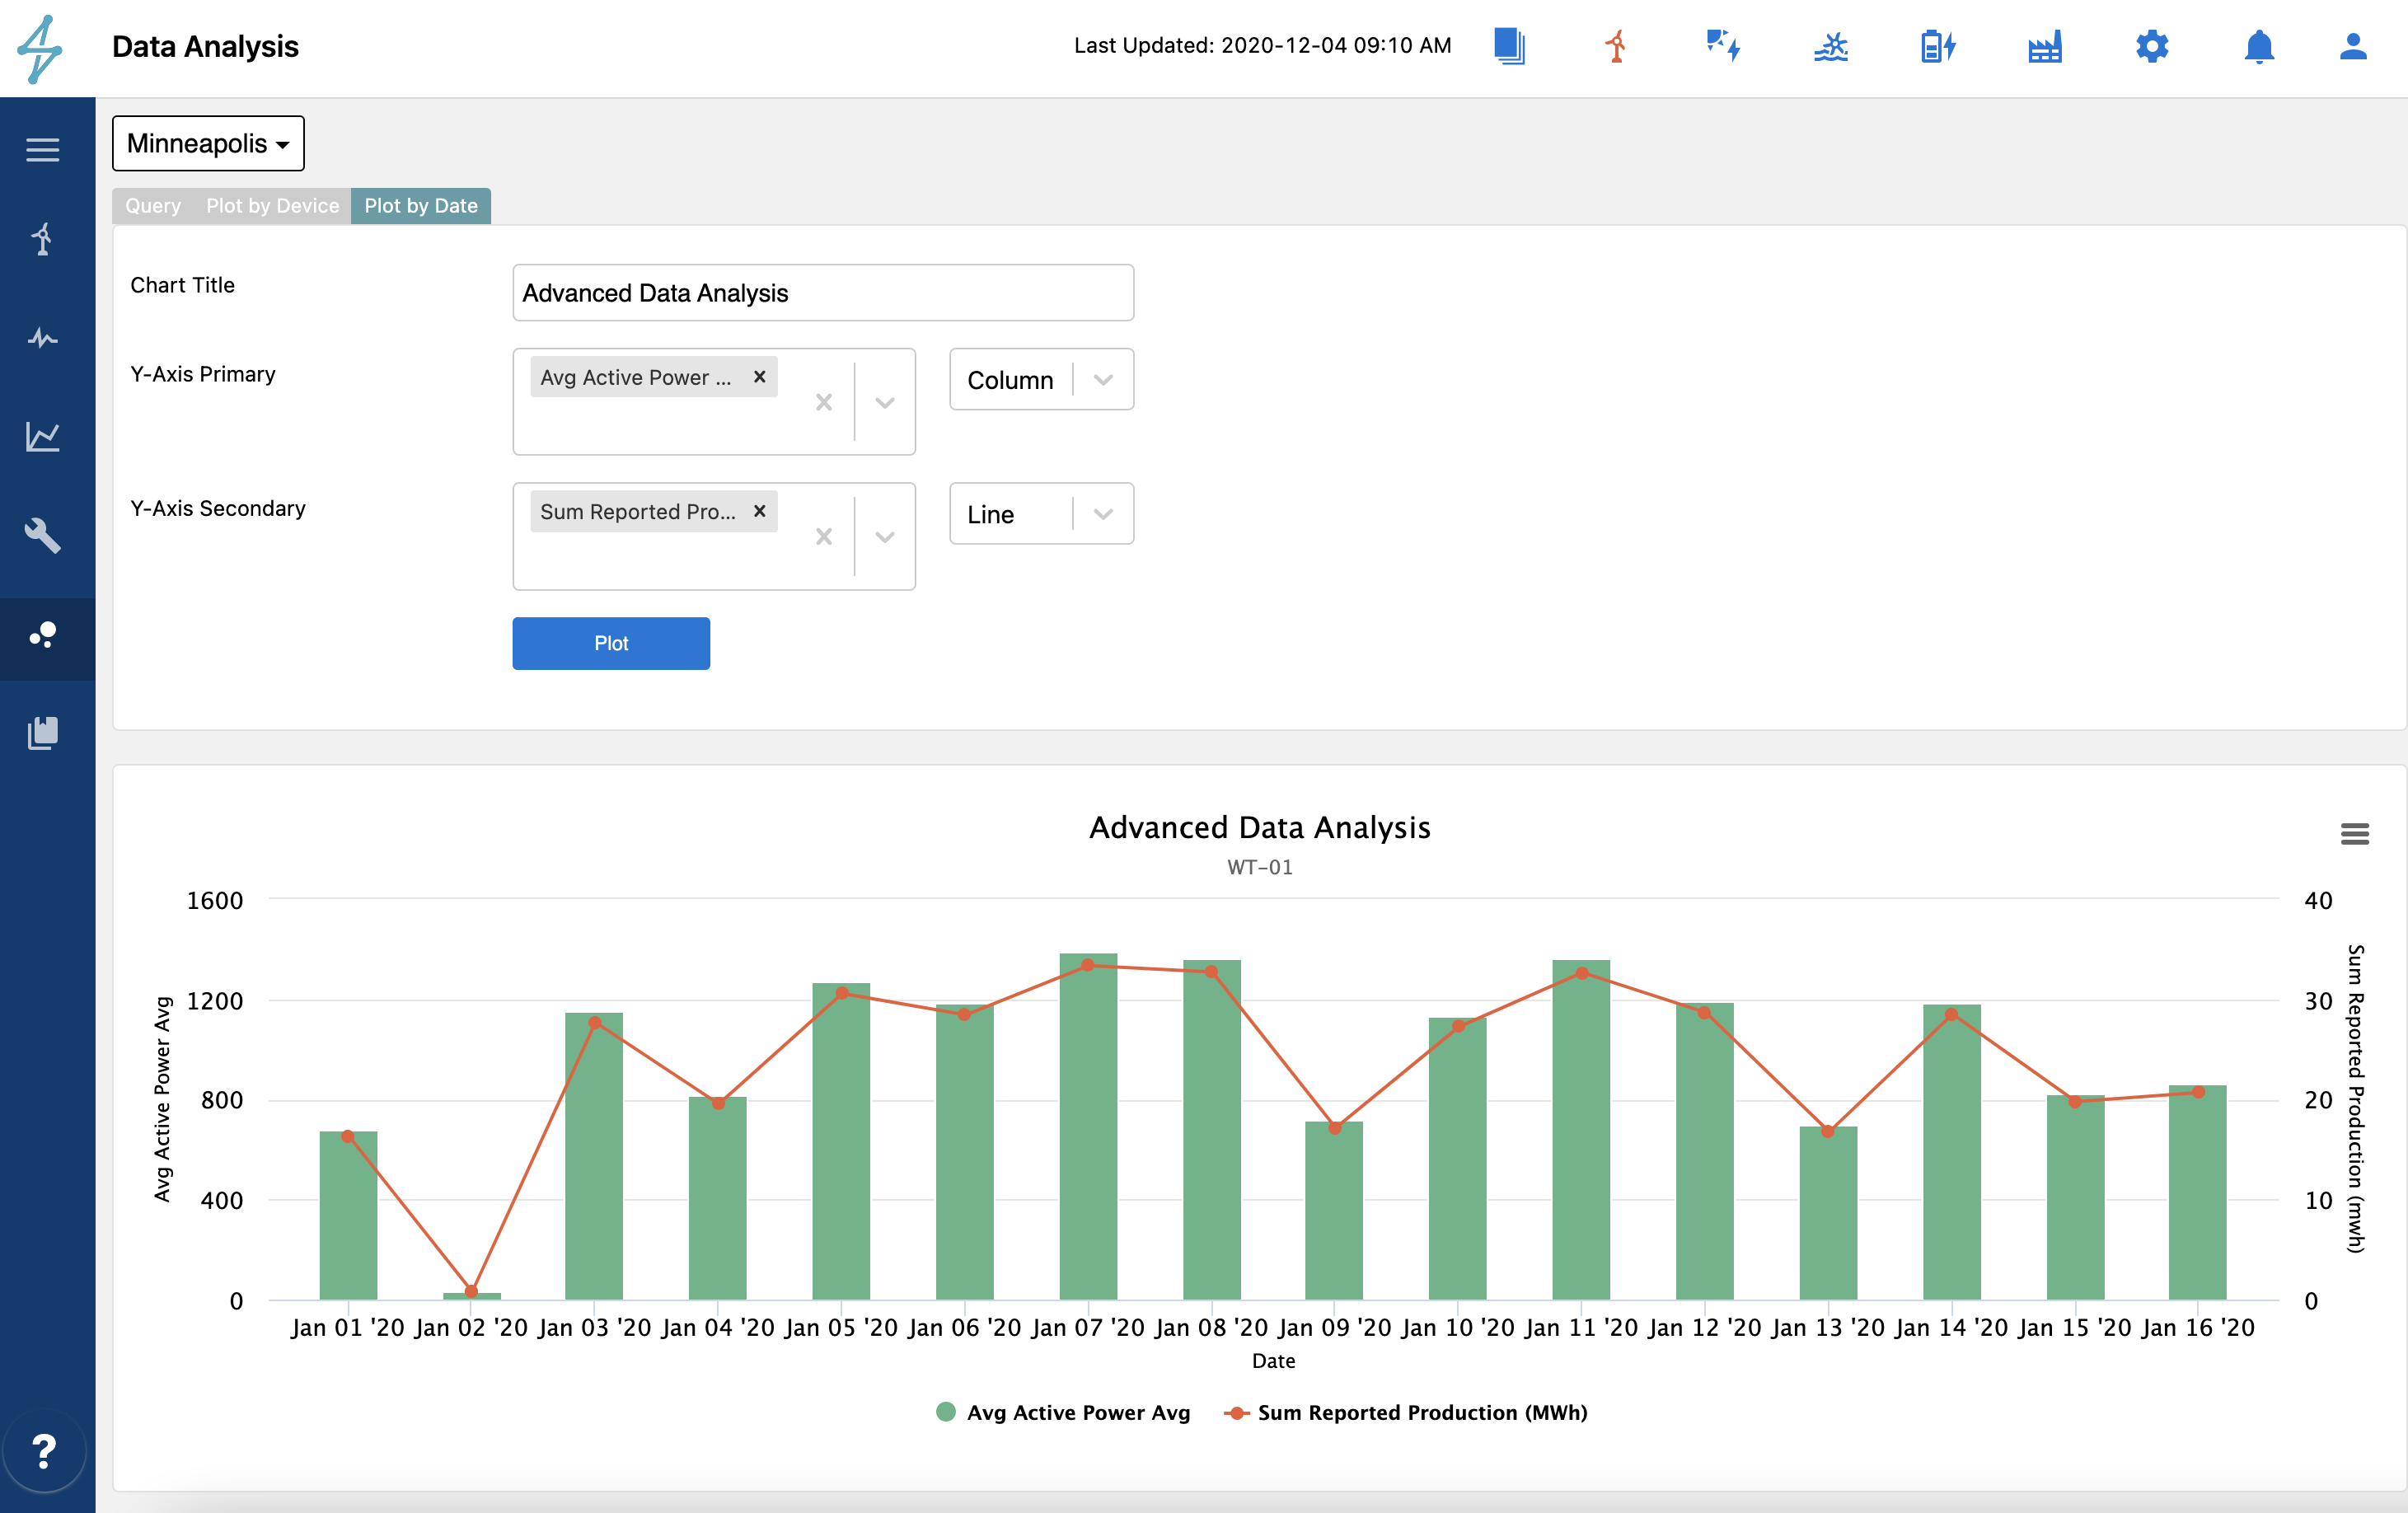
When you land on the Data Analysis page, you will see a Query tab that allows you to select the data and click apply. Once the data is loaded, you will see two additional tabs for Plot by Device and Plot by Date appear. Those are pre-loaded with drop downs from the data fields queried
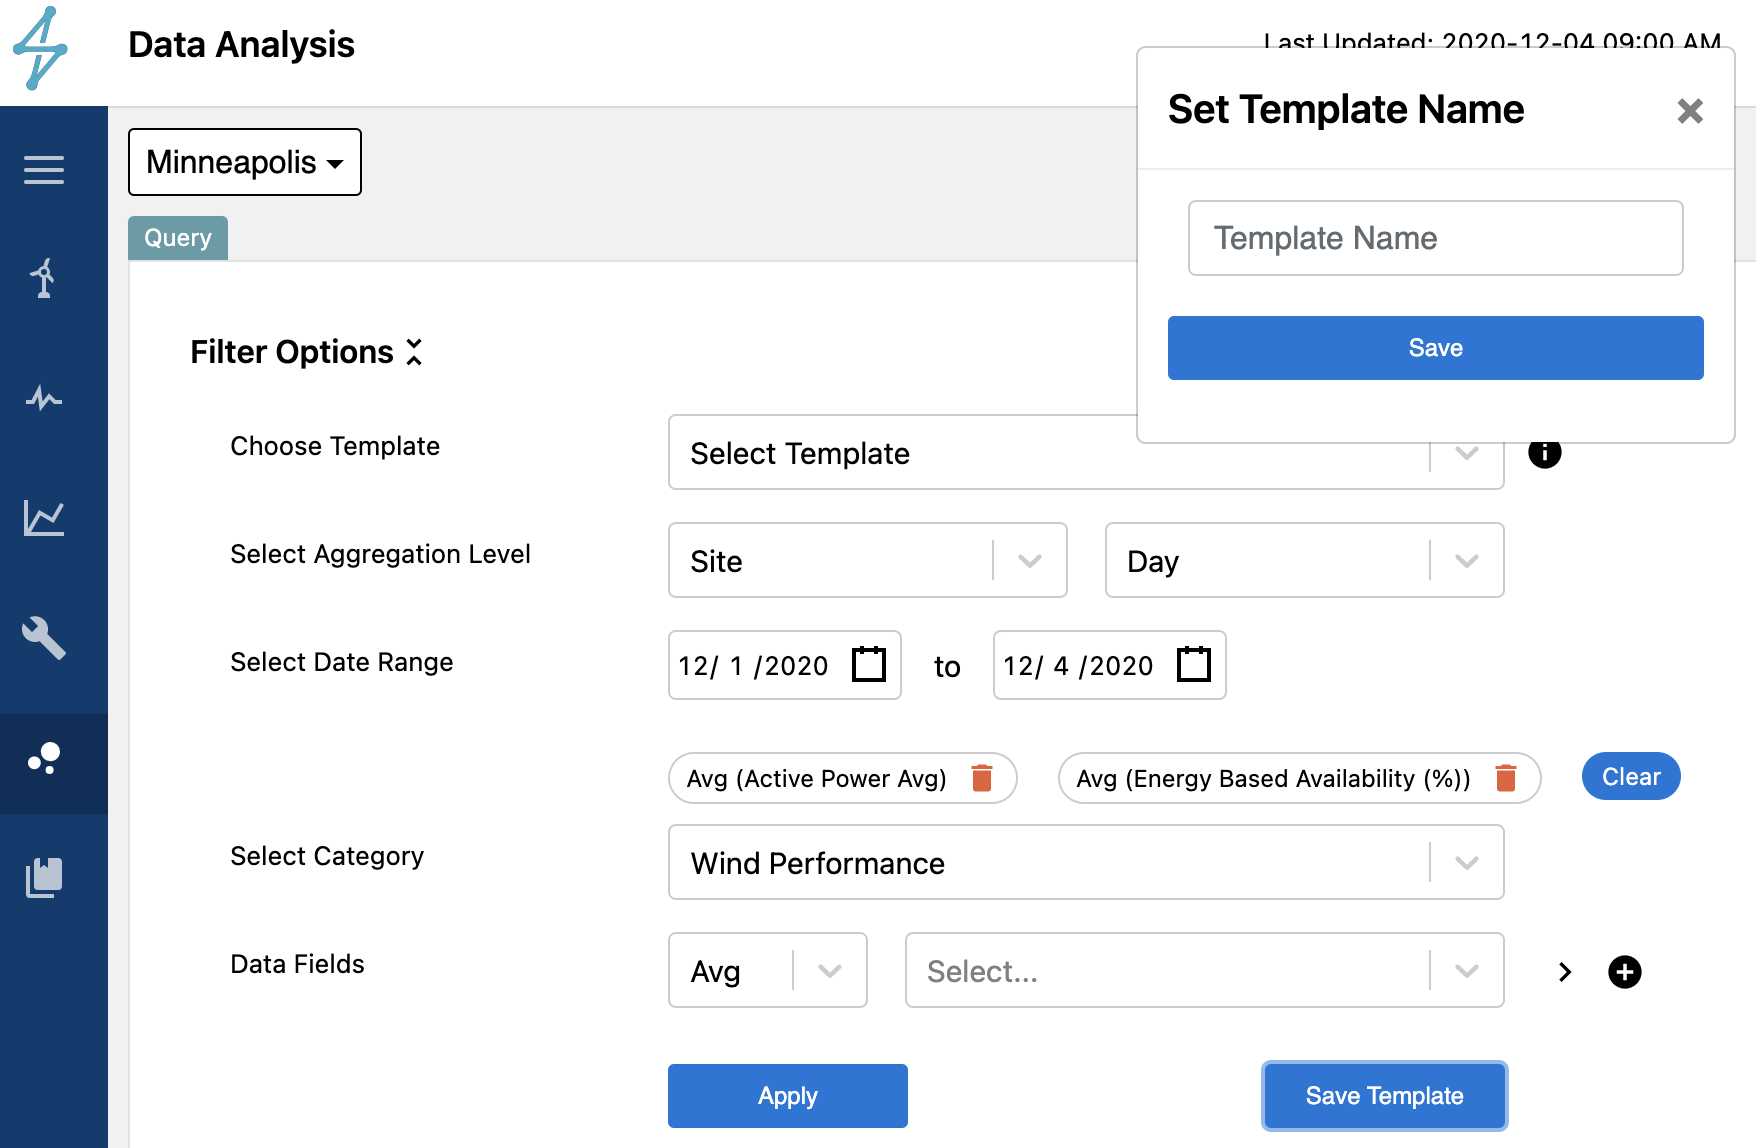
Like other Analysis Module tools, you can save your form as a template and label it for you and your colleagues to reuse. You can do so by clicking the "Save Template" button and inputting a name.
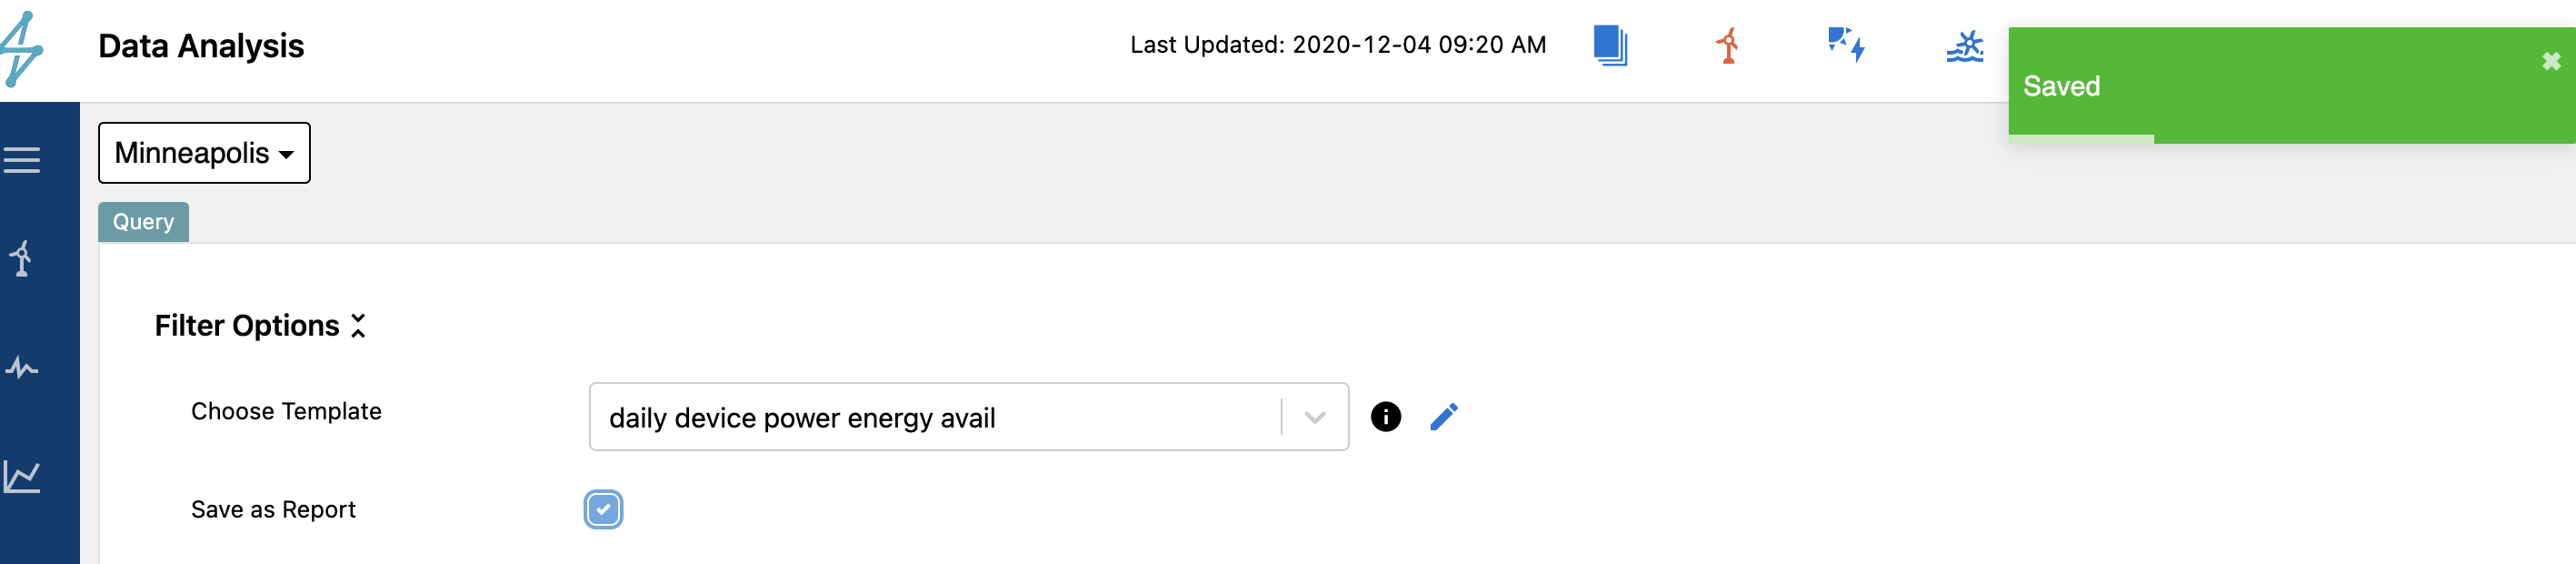
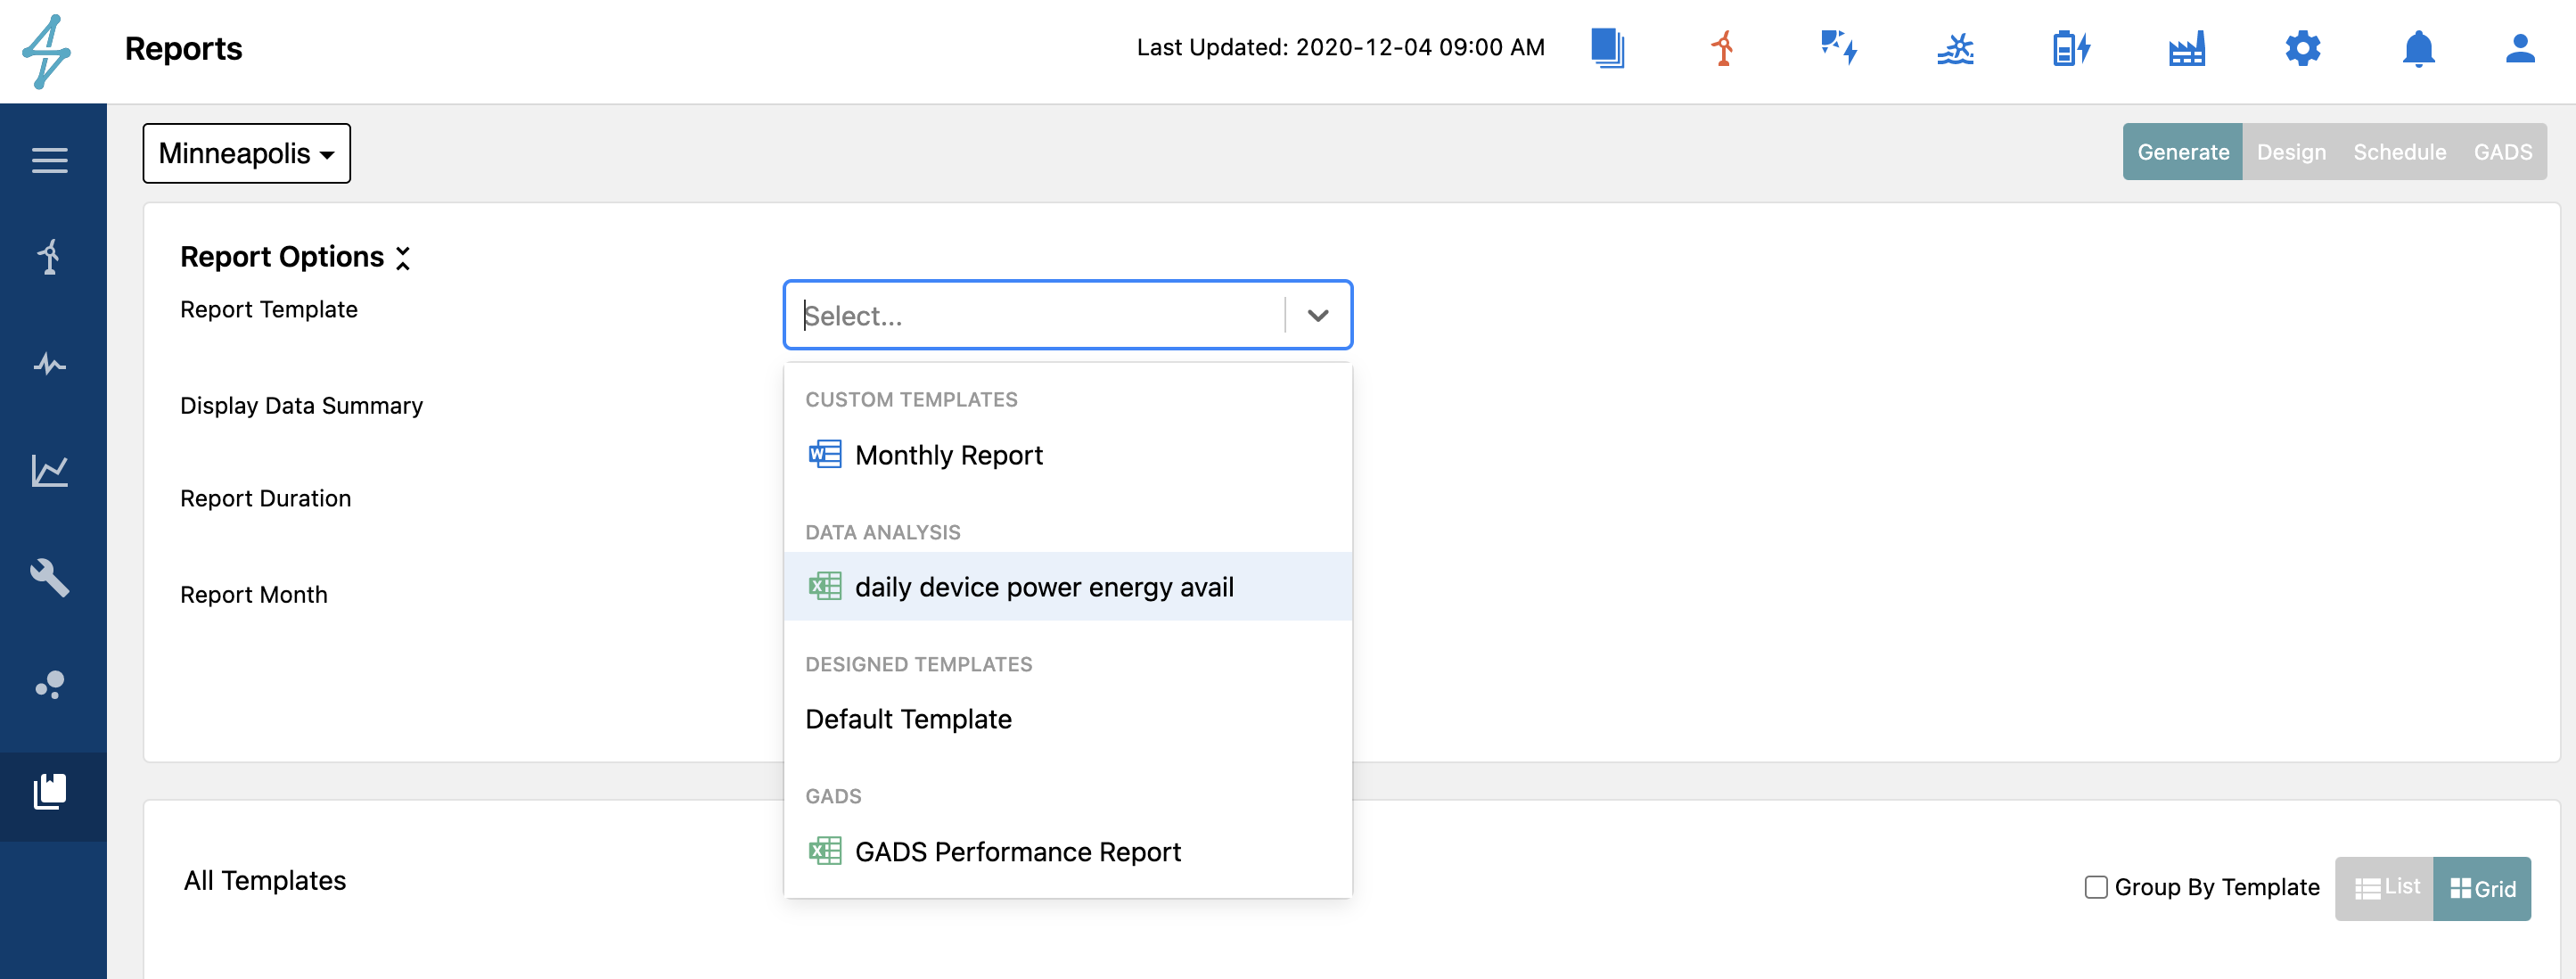
Once you have a template saved, you will notice a checkbox added to the input fields that is called "Save as Report". By checking this checkbox, it will confirm Saved with a green bar in the upper right, and then you will be able to then find it in the drop downs under the Reports module referenceable for both report Generation and Scheduling. While the saved template records your date range in the analysis module, when called in the reports it will respect the time range specified in the report such as "repeat every week for the previous week" from the first send report on date specified.
🚧
Editing/Removing Templates that are Scheduled as Reports
If you have a report scheduled utilizing your template, then you cannot delete the template on the Data Analysis page until you have removed the scheduled report relying on it.
You will also get a warning message when you try to resave a template that is referenced in a report asking are you sure given its dependency.
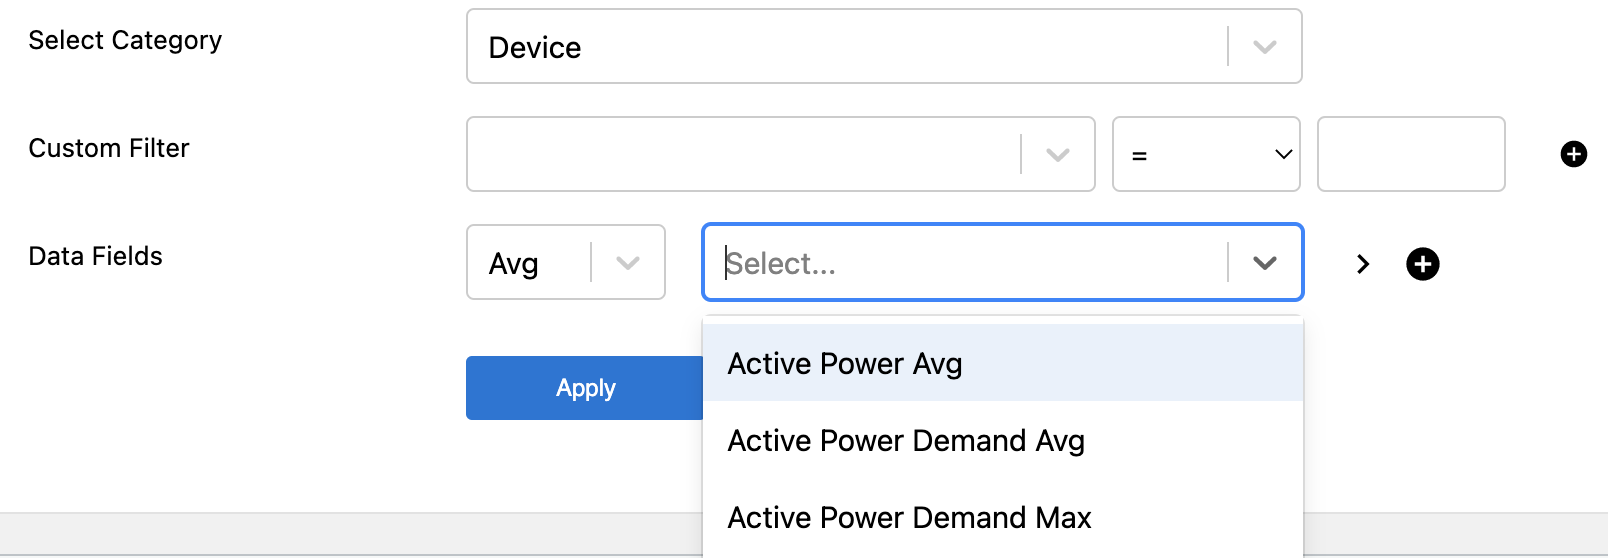
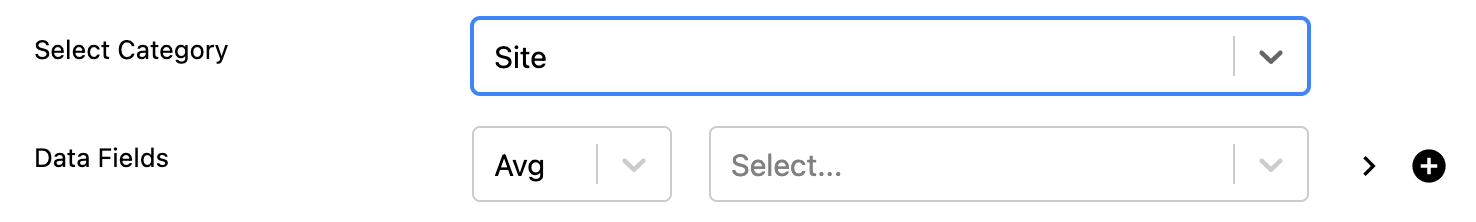
Depending on modules enabled for the asset, the Data Analysis may have any of the following categories to select data fields from. Note the plus button next to each field; you must use that to add the variable to the form. You can select as many variables across multiple categories.
Device Data is the 10min aggregated device (turbine or inverter block) data that is available throughout the platform and consistent with the device mappings and searchable by the ones that are checked as displayed on the device mapping page under Admin/Assets/Mappings/Device. This then get's aggregated into the specified aggregation level for hourly/daily/monthly/quarterly with the aggregation method (avg/sum/etc.) specified for that tag.
Site Data is the 10min aggregated site data that is available throughout the platform and consistent with the device mappings and searchable by the ones that are checked as displayed on the device mapping page under Admin/Assets/Mappings/Site. This then get's aggregated into the specified aggregation level for hourly/daily/monthly/quarterly with the aggregation method (avg/sum/etc.) specified for that tag.
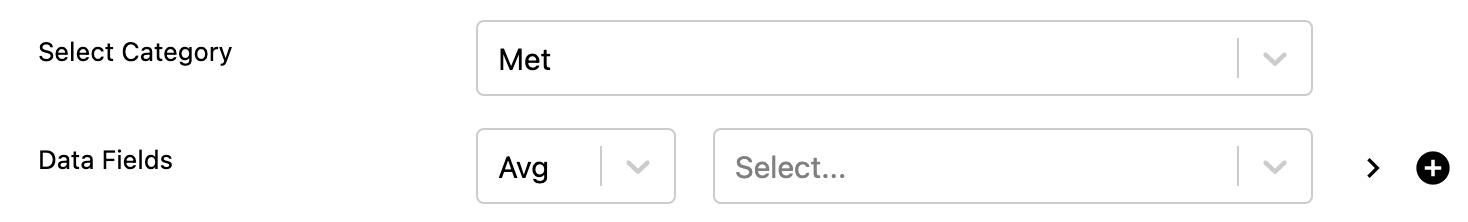
Met Data is the 10min aggregated metrological station data that is available throughout the platform and consistent with the device mappings and searchable by the ones that are checked as displayed on the device mapping page under Admin/Assets/Mappings/Site. This then get's aggregated into the specified aggregation level for hourly/daily/monthly/quarterly with the aggregation method (avg/sum/etc.) specified for that tag.
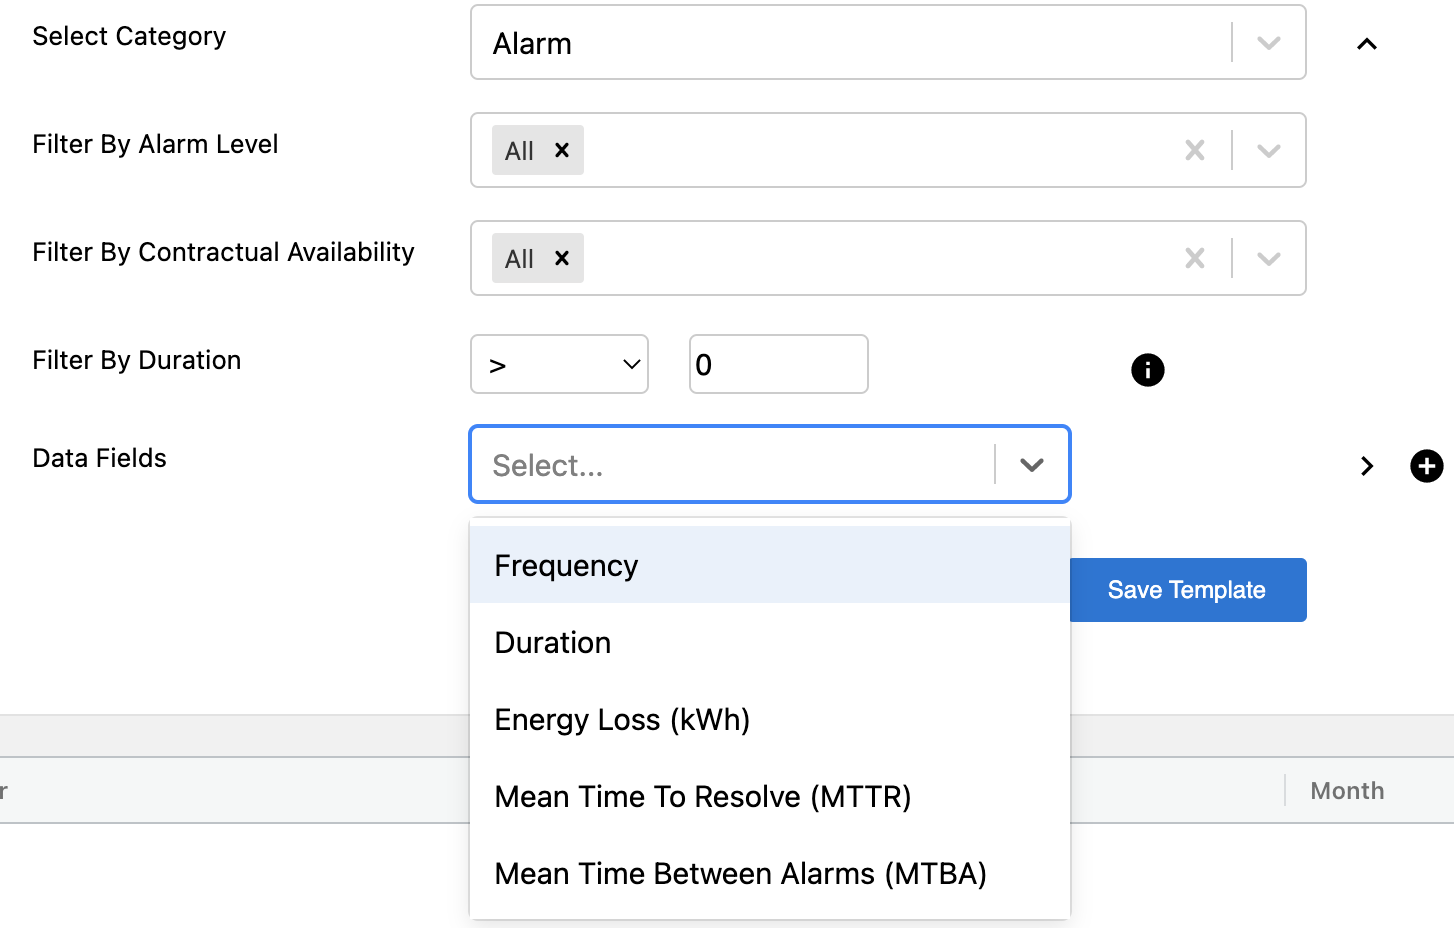
Alarms enables you to query summary data about alarms for the aggregation period in question based on the set of alarms that are filtered in the selections. You can filter for alarm level, contractual availability and duration of alarm similar to the alarms module.
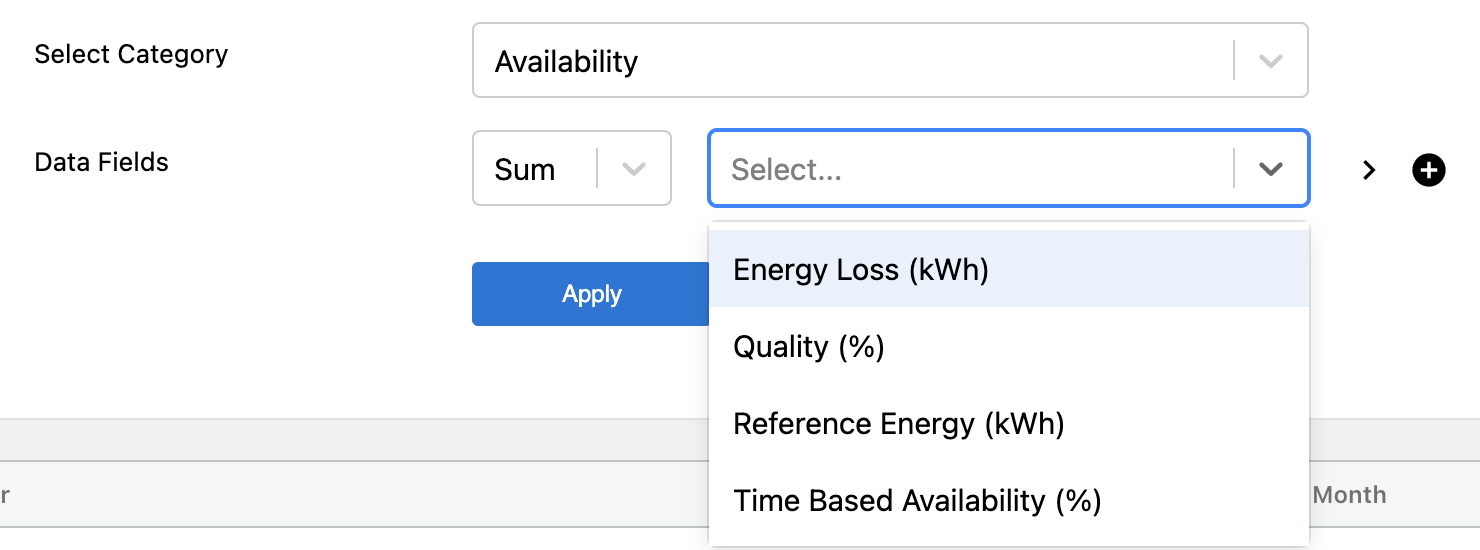
Availability provides access to time based availability as well as reference energy and energy loss associated with that time period per aggregation level. Energy based availability is available through the performance table but not the availability table.
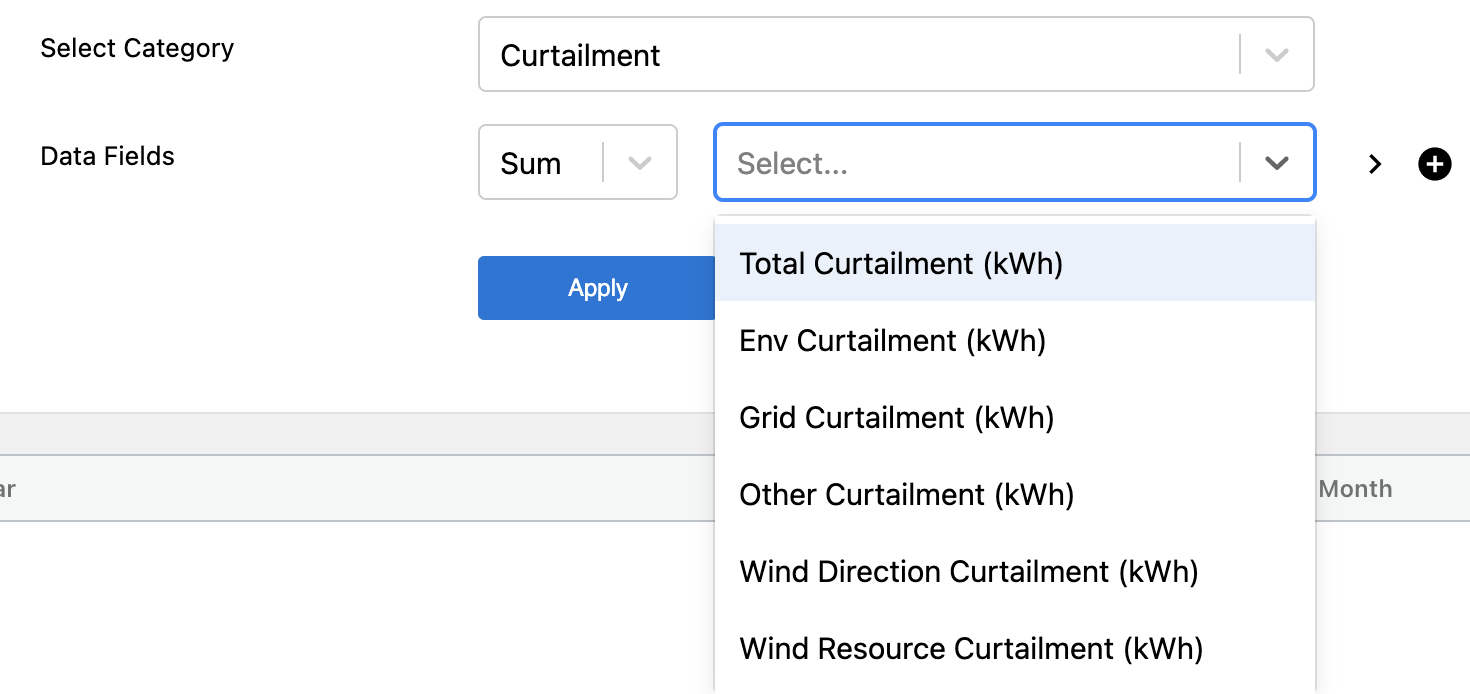
Curtailment reflects the curtailment categories and subcategories in the curtailment module and table. The configuration for which categories include what alarm code resides in the JSON configuration under the Asset table in the Admin menu in the column labeled Additional Information.
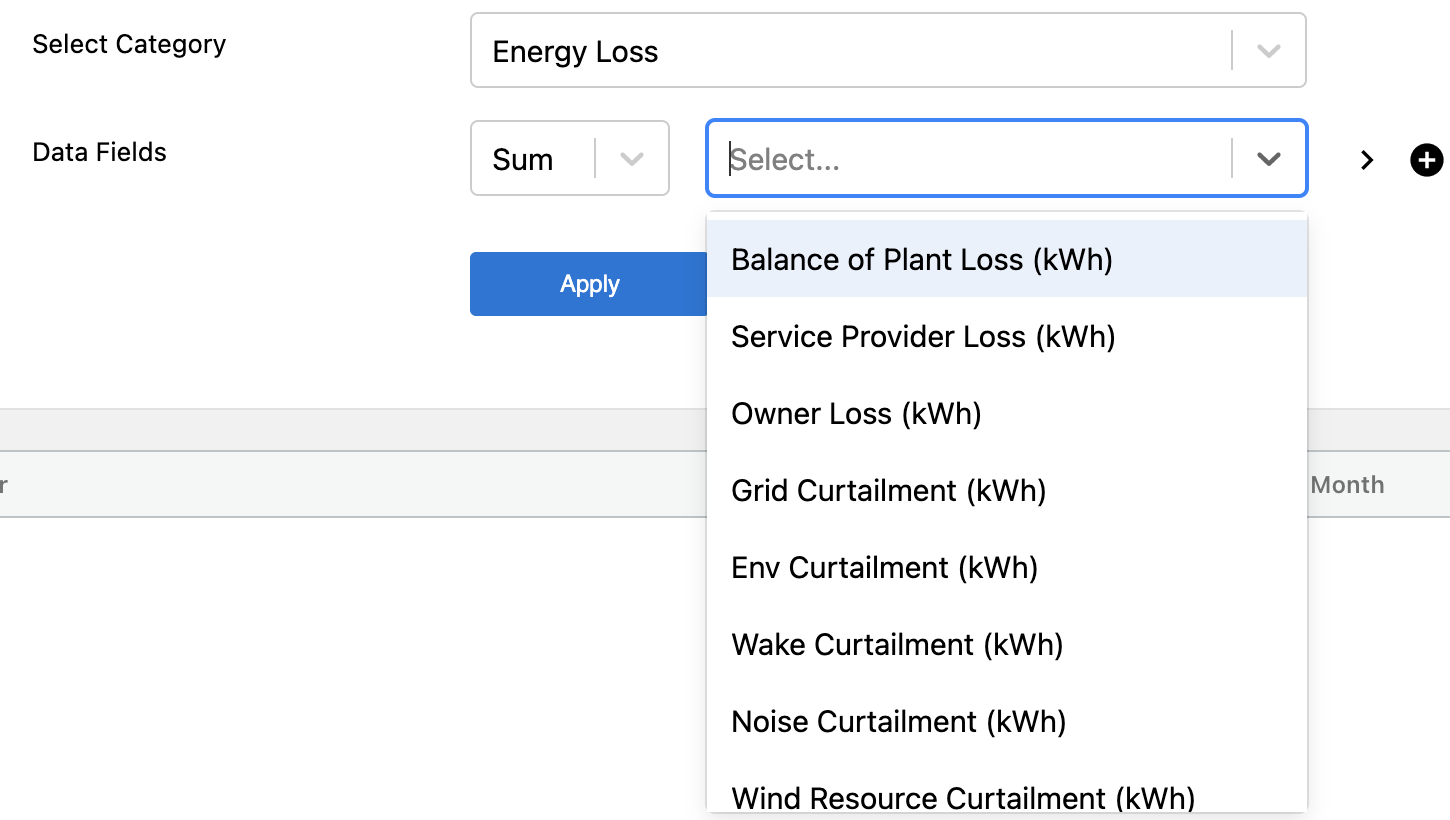
Energy Loss is the aggregation of availability and curtailment energy losses expanded to include all subcategories configured.
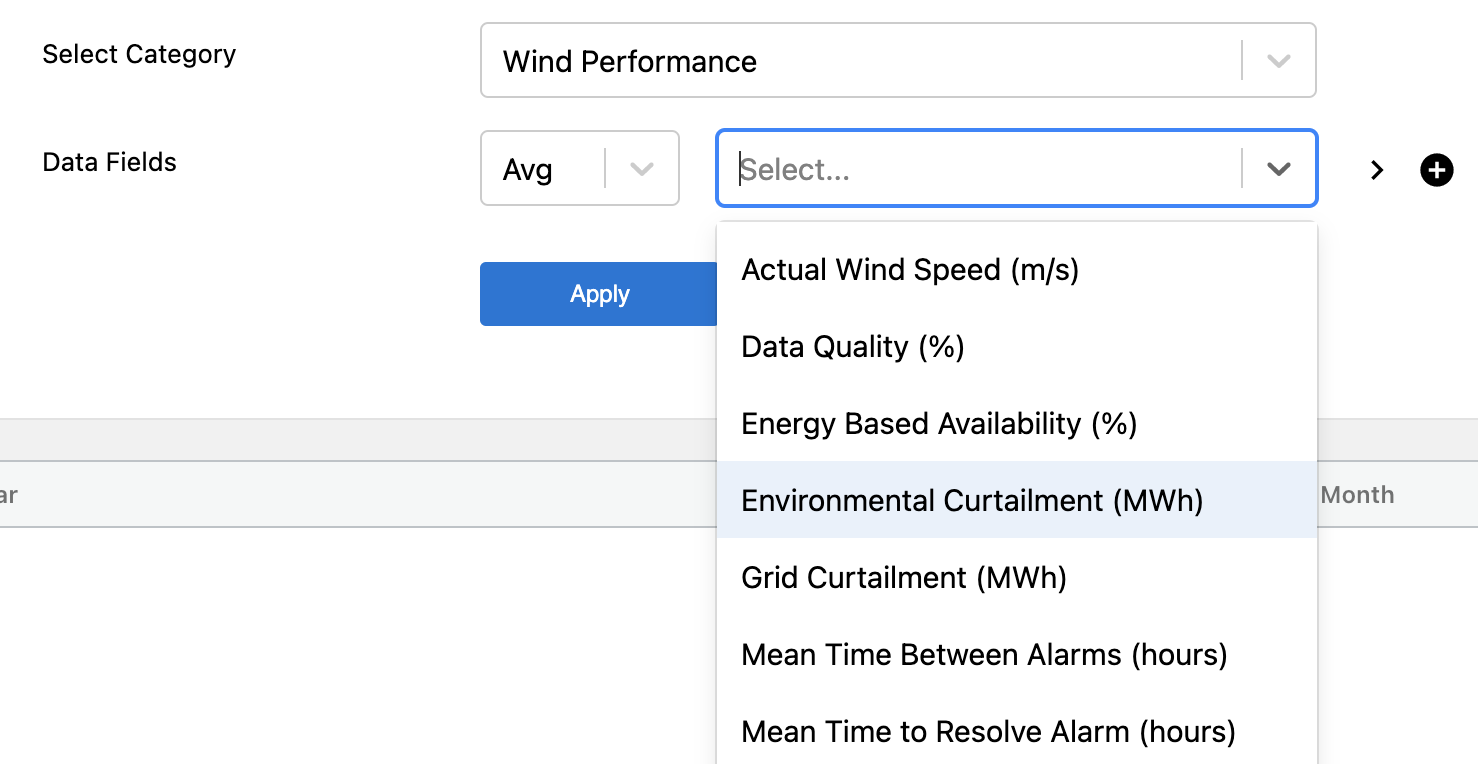
Performance is consistent with the asset performance table on the asset overview page. It includes summaries of production, energy loss, availability, average wind speed, and other KPIs down to an hourly aggregation granularity. Some of these are repetitive from a set of metrics in other tables, but assuming the same filters as the configurations for the Asset Performance Table, the results should be consistent.
🚧
Multiple Filter Sets
Today you can only include a data field with a given set of filters once. You do not have the ability to add the same variable twice with a different set of filters. If you do, it will save over the existing way that field was added.
🚧
Performance Metrics Available Down to Hourly Only
Performance metrics are available daily at minimum, and therefore you will receive a warning when querying over an hourly aggregation that these values will appear for the day and be listed at the 0th hour for the day.