There are many common behaviors that are consistent features found across many modules in the Renewable Suite.
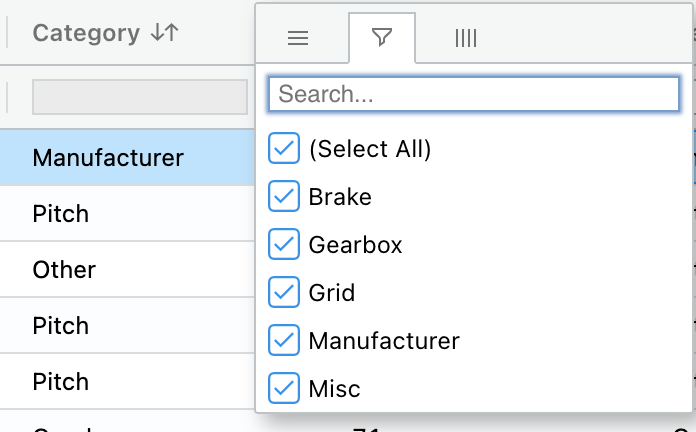
- right click on the column headers to filter - you can search and multi select values
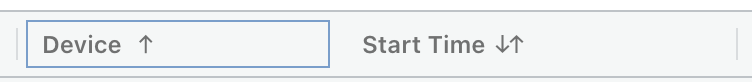
- left click on the column header to sort (keep clicking to switch between low to high and high to low)
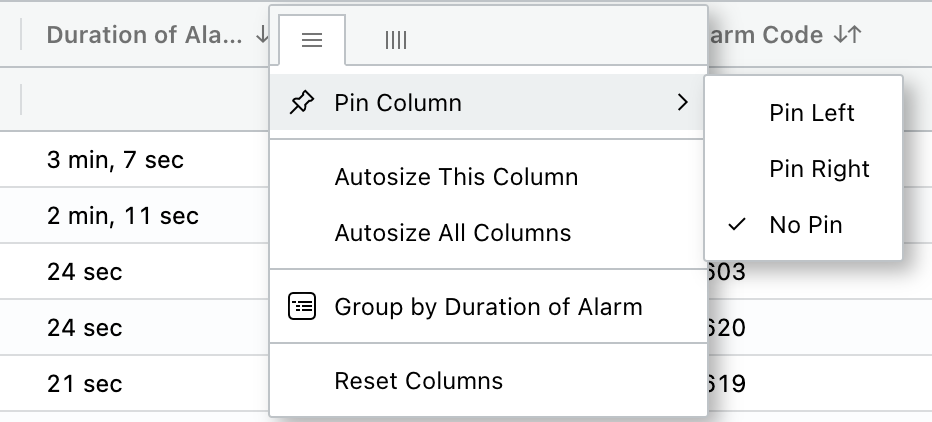
- right click on the column header to reset columns
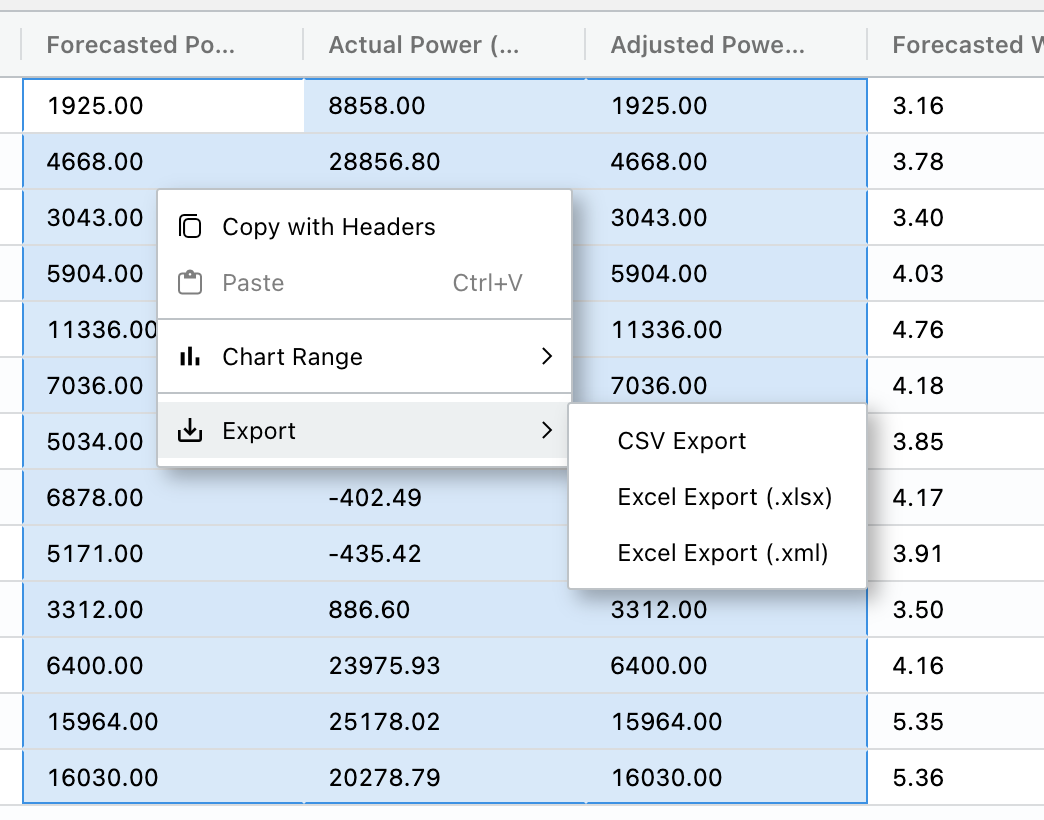
- right click on the table - single cell or highlight multiple cells - to copy or export. Note that if you copy, it is copying the cells you selected. If you export, this exports the whole table. Copy only copies the cell highlighted, copy with headers will copy the full row with the column names.
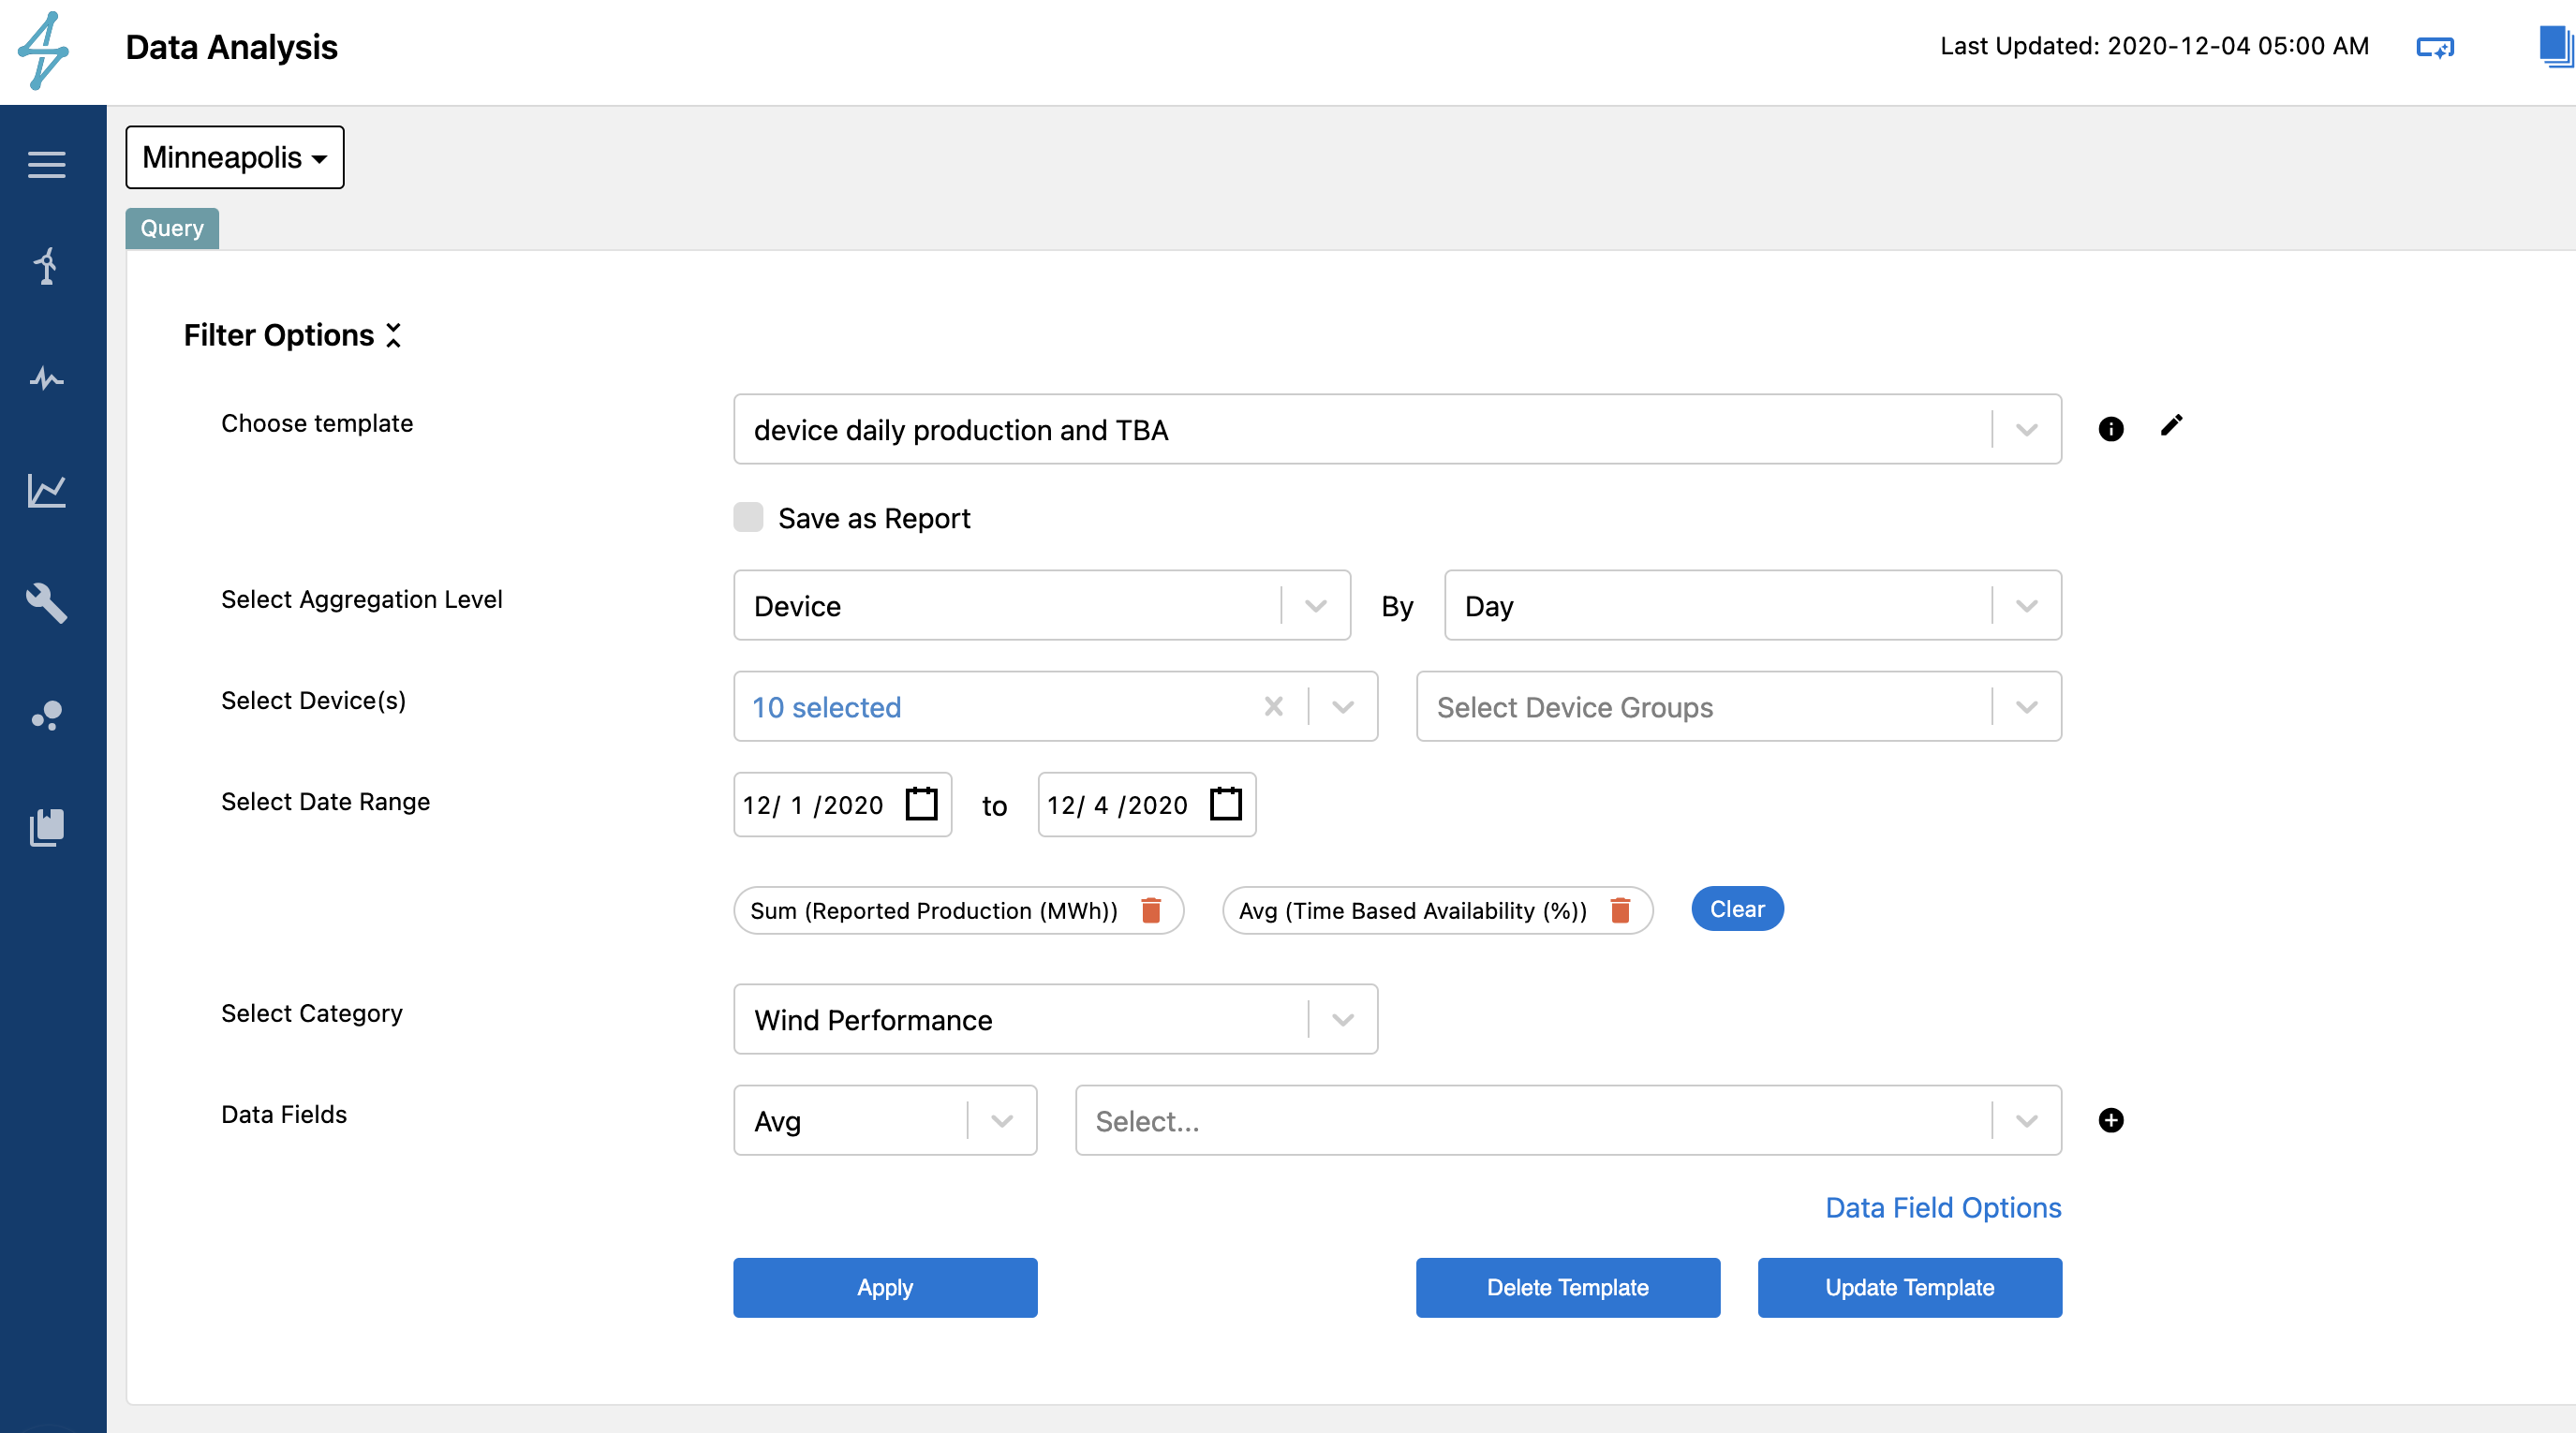
On any of the visualization modules, plot modules, data analysis module, and alarms module pages, there are a series of filters that can be saved as templates to reference later and collaborate with colleagues. These templates are public to all users that have permissions to that asset/module. Use the "Save Template" button at the bottom of the filters to save a template. This will prompt a pup up to save a template name. That name can then be referenced in the choose template drop down.
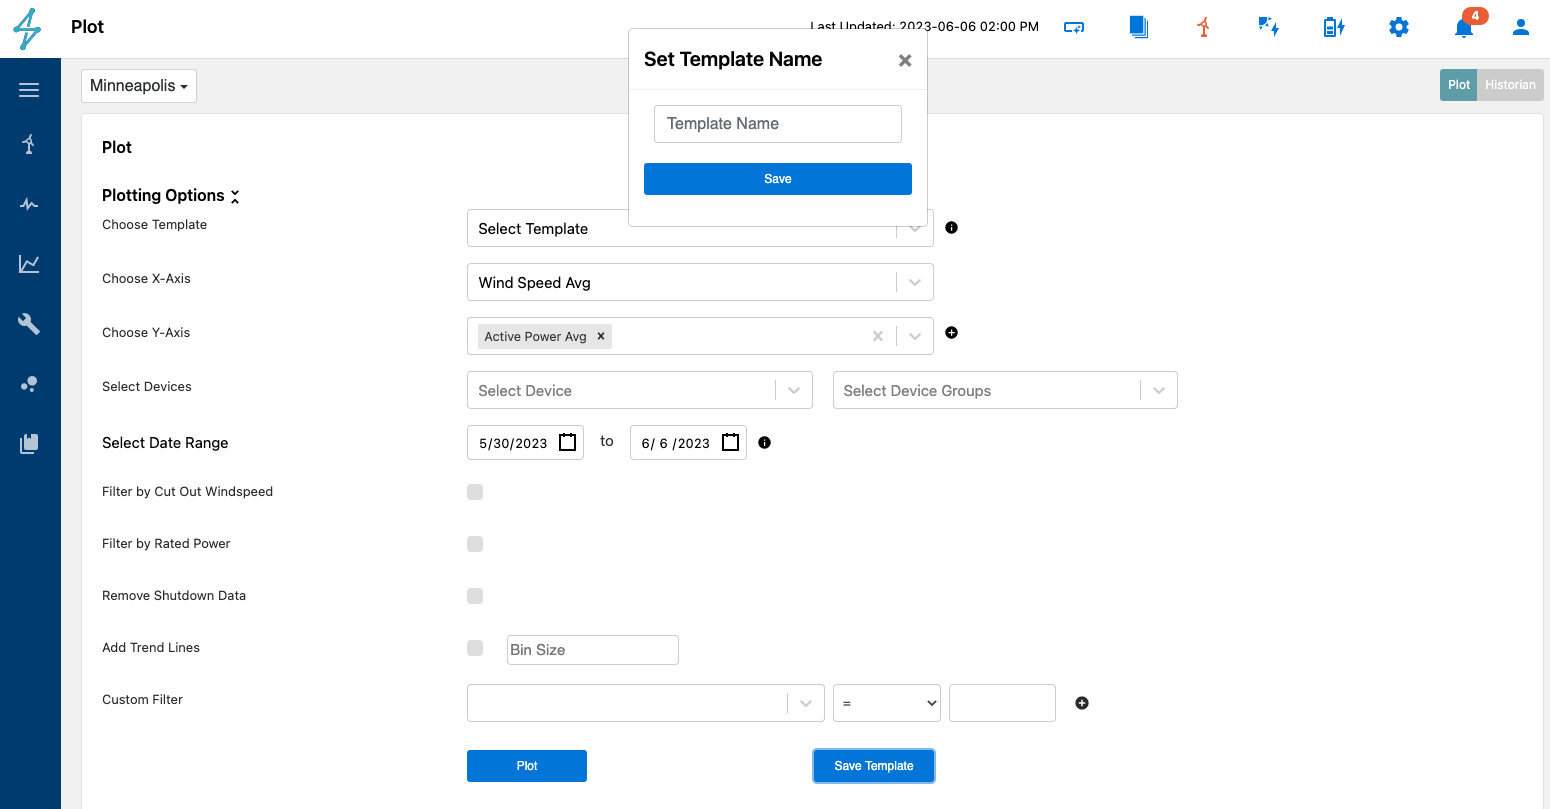
Once a template is saved, you can find it in the choose template drop down. You can delete the template or update the template as needed. For changes of the template name, use the edit pencil button next to the template drop down which will make that template name editable, make your changes, then click the "Update Template" button to save changes.
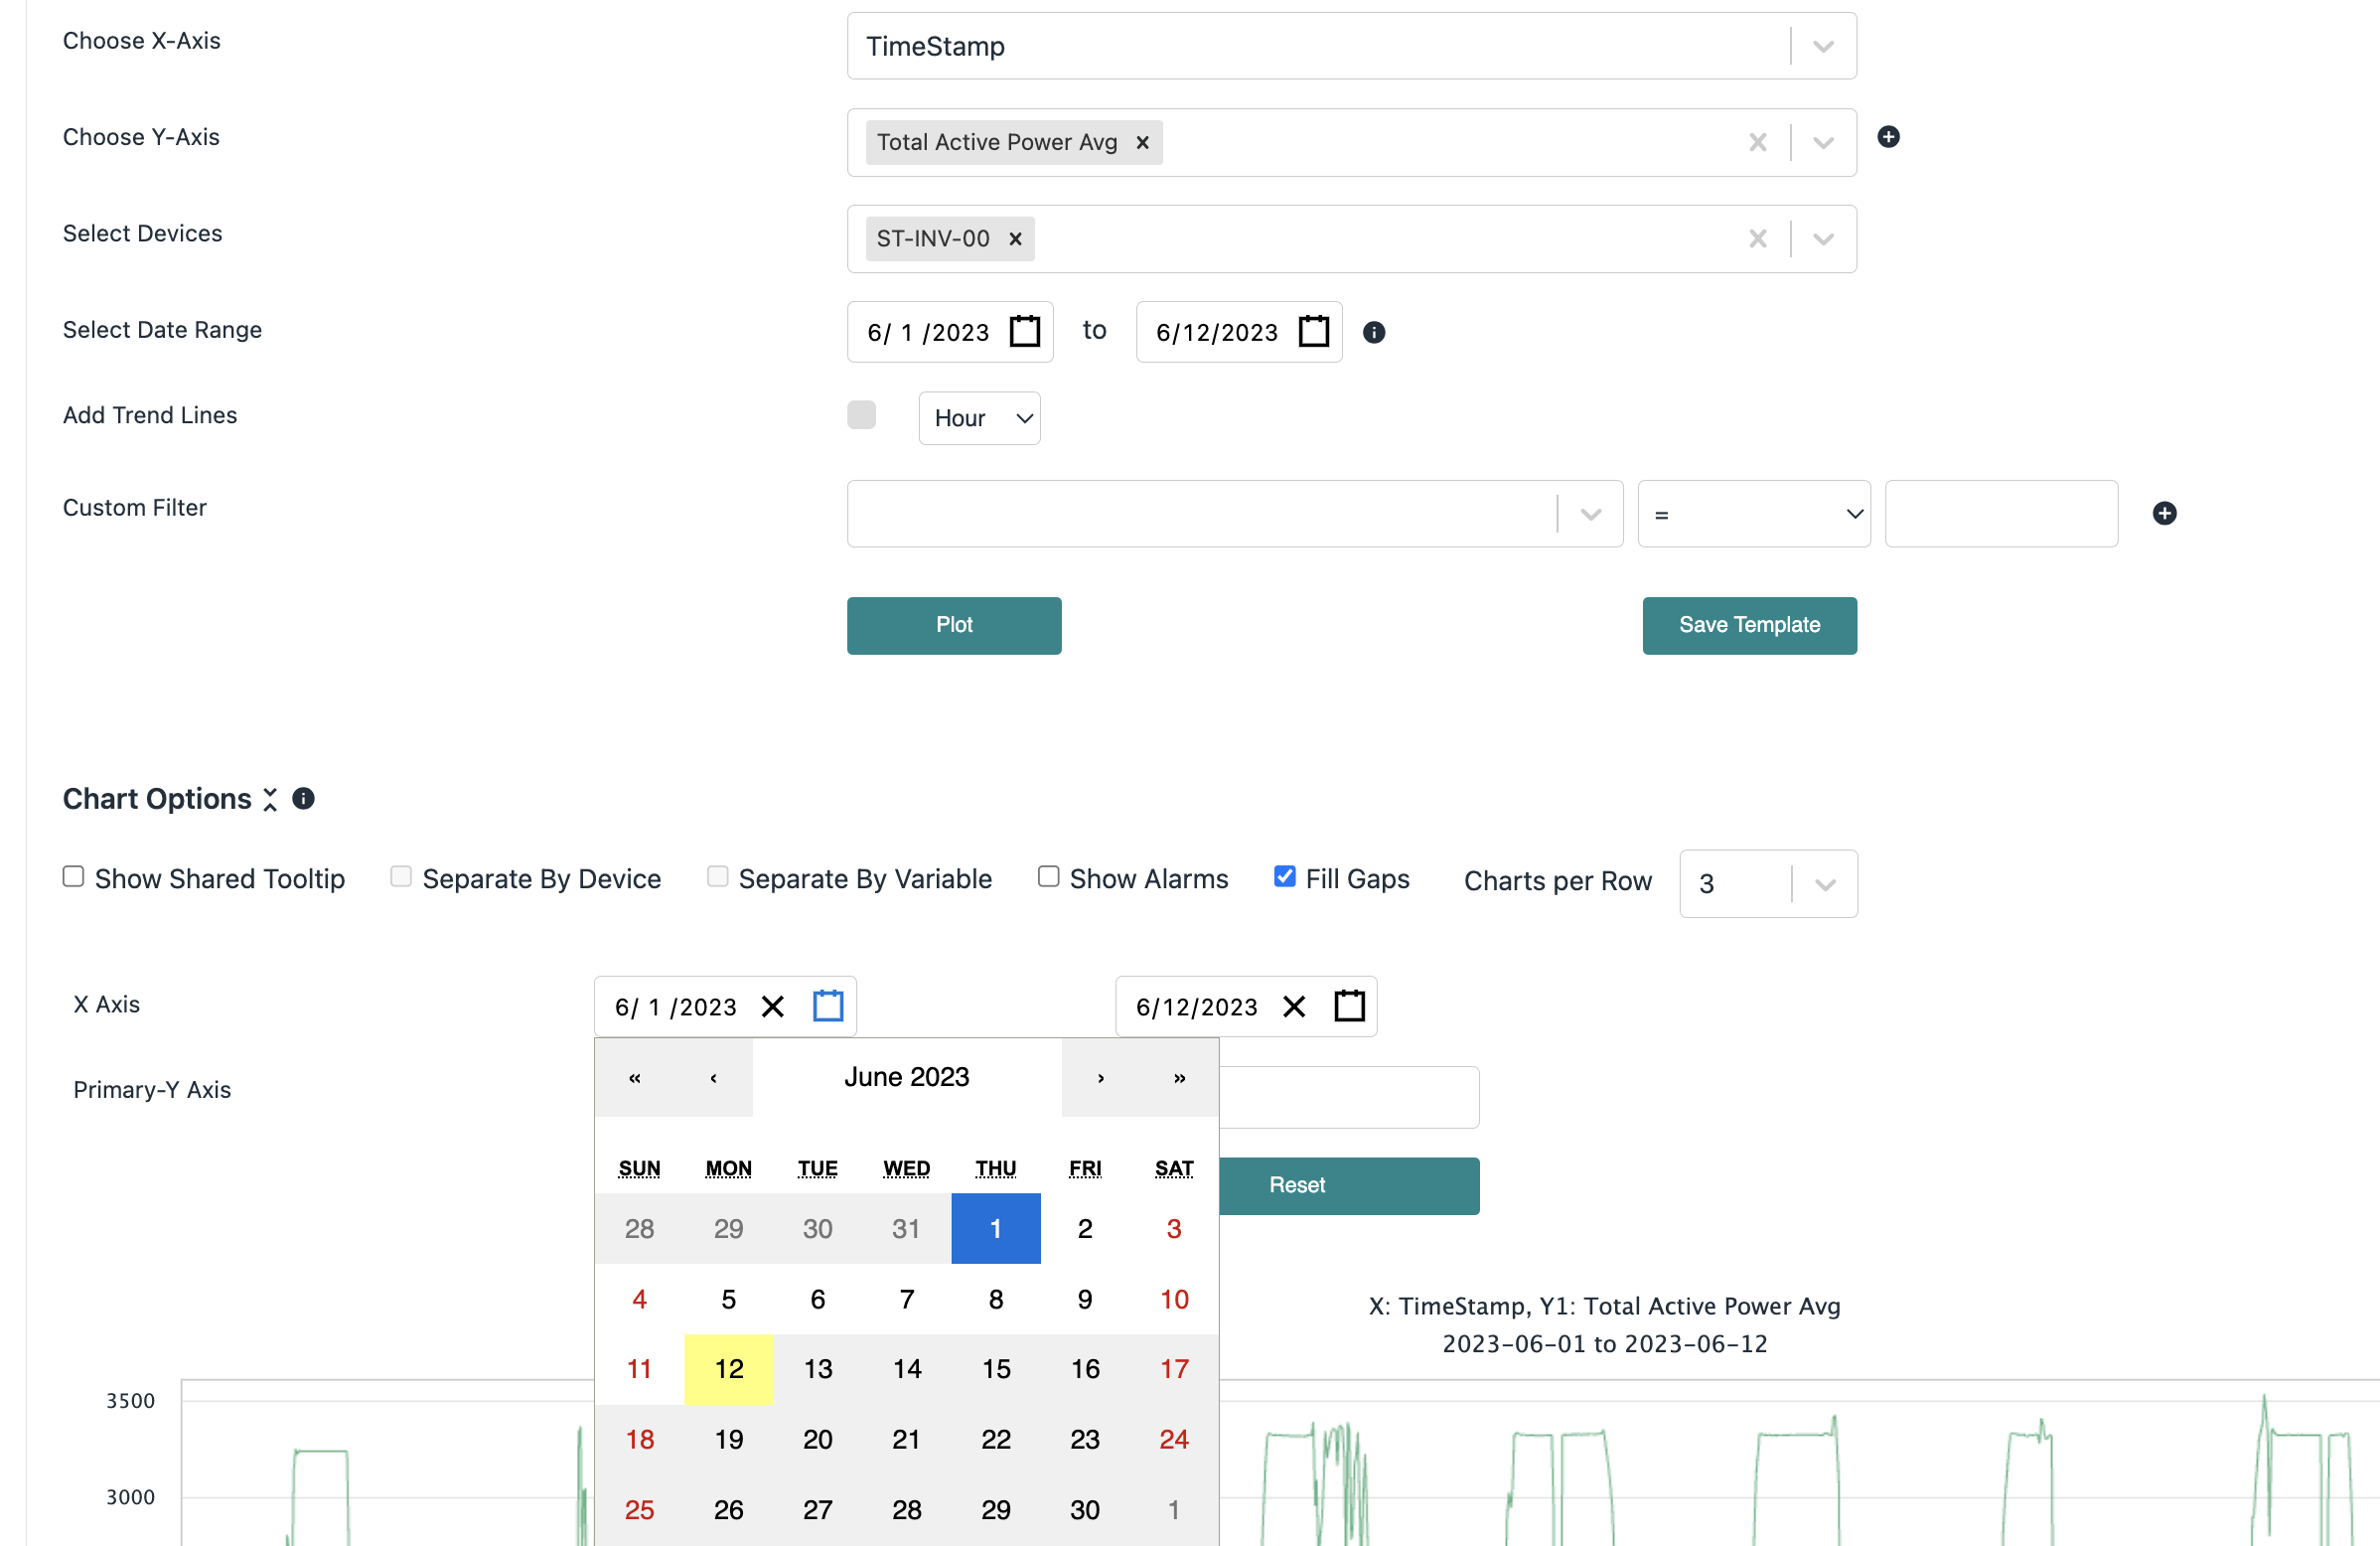
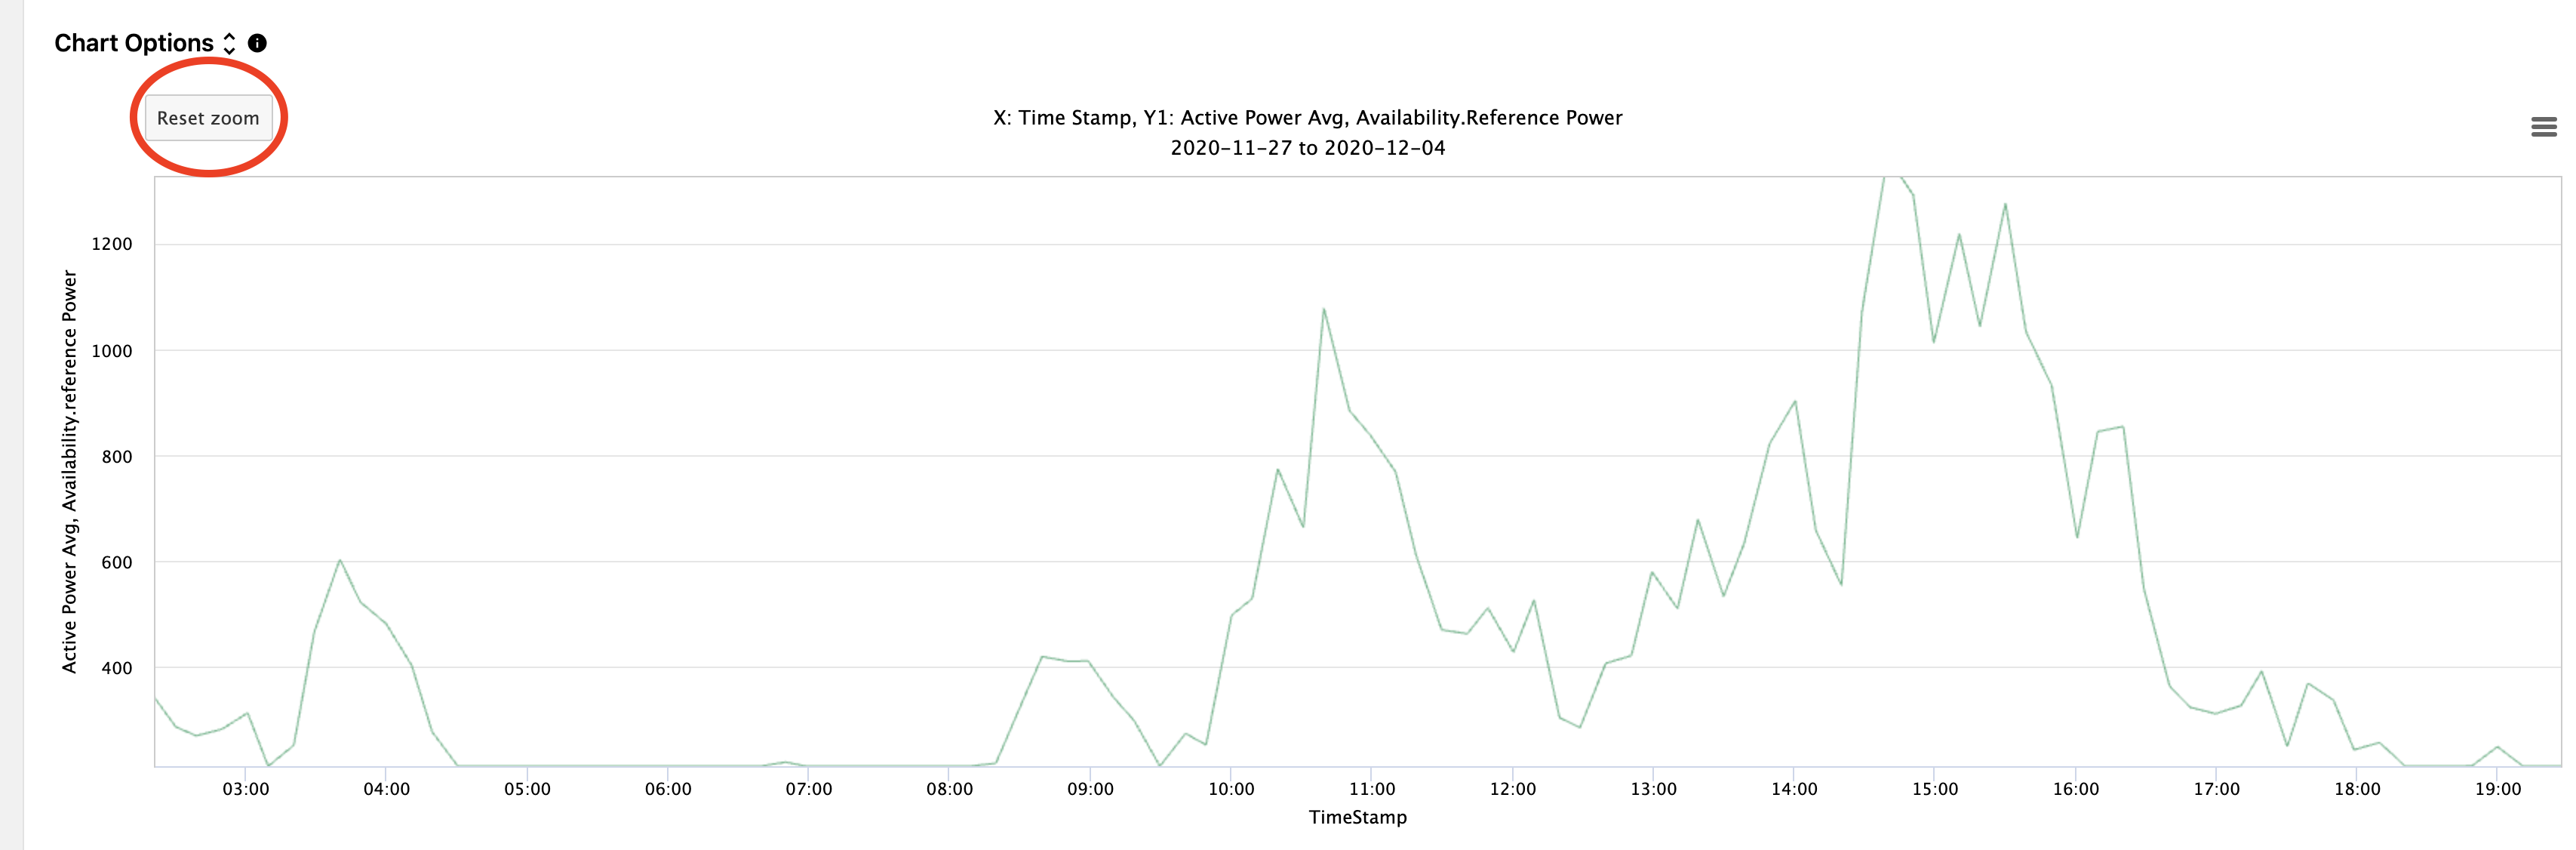
For any plots throughout the UI, there is a set of chart options that enable additional configuration.
- Pan and zoom by highlighting sections of the chart. Reset zoom with the button that will appear in the upper right corner of the plot once you are zoomed in.
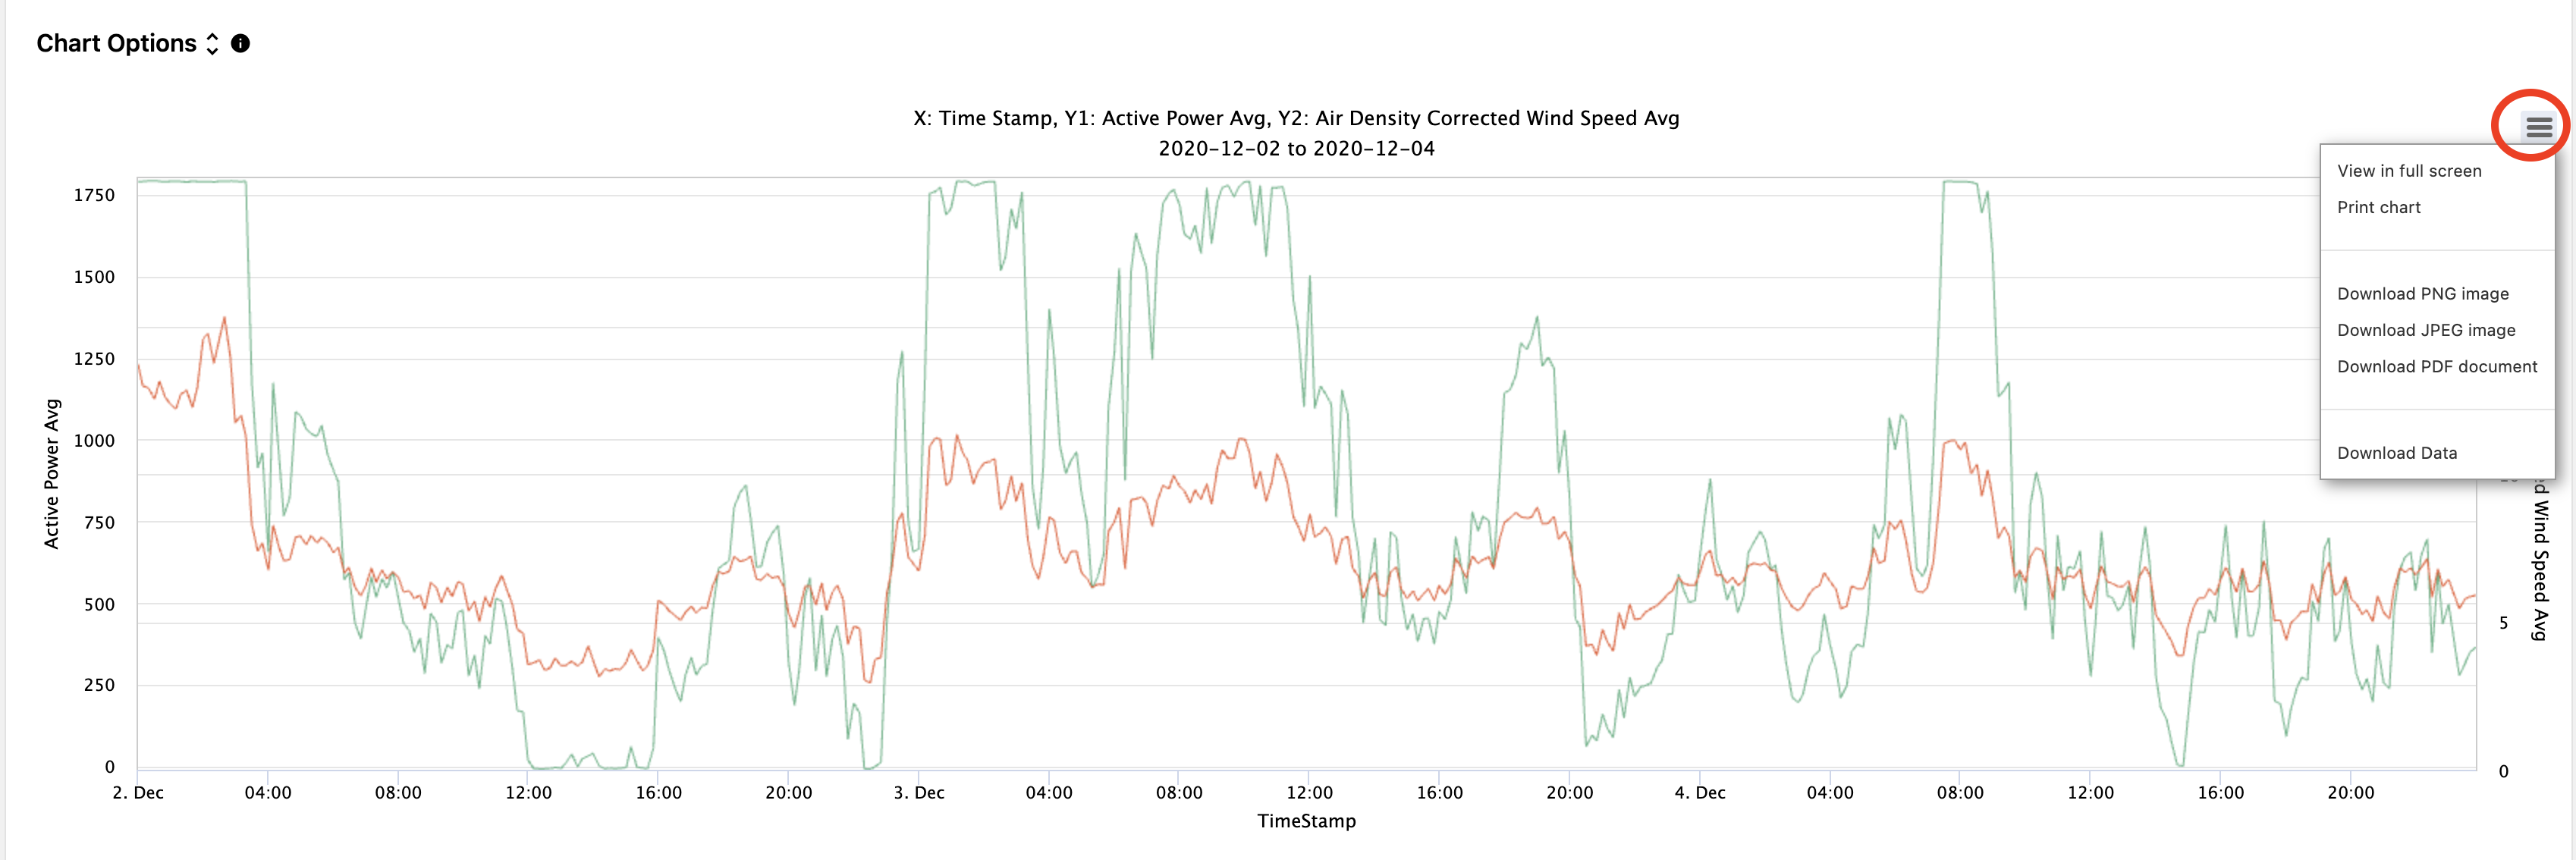
- Download data or image by clicking on the menu icon in the upper right hand corner of a plot. Note than any chart options you enable will be reflected in the image download as well.
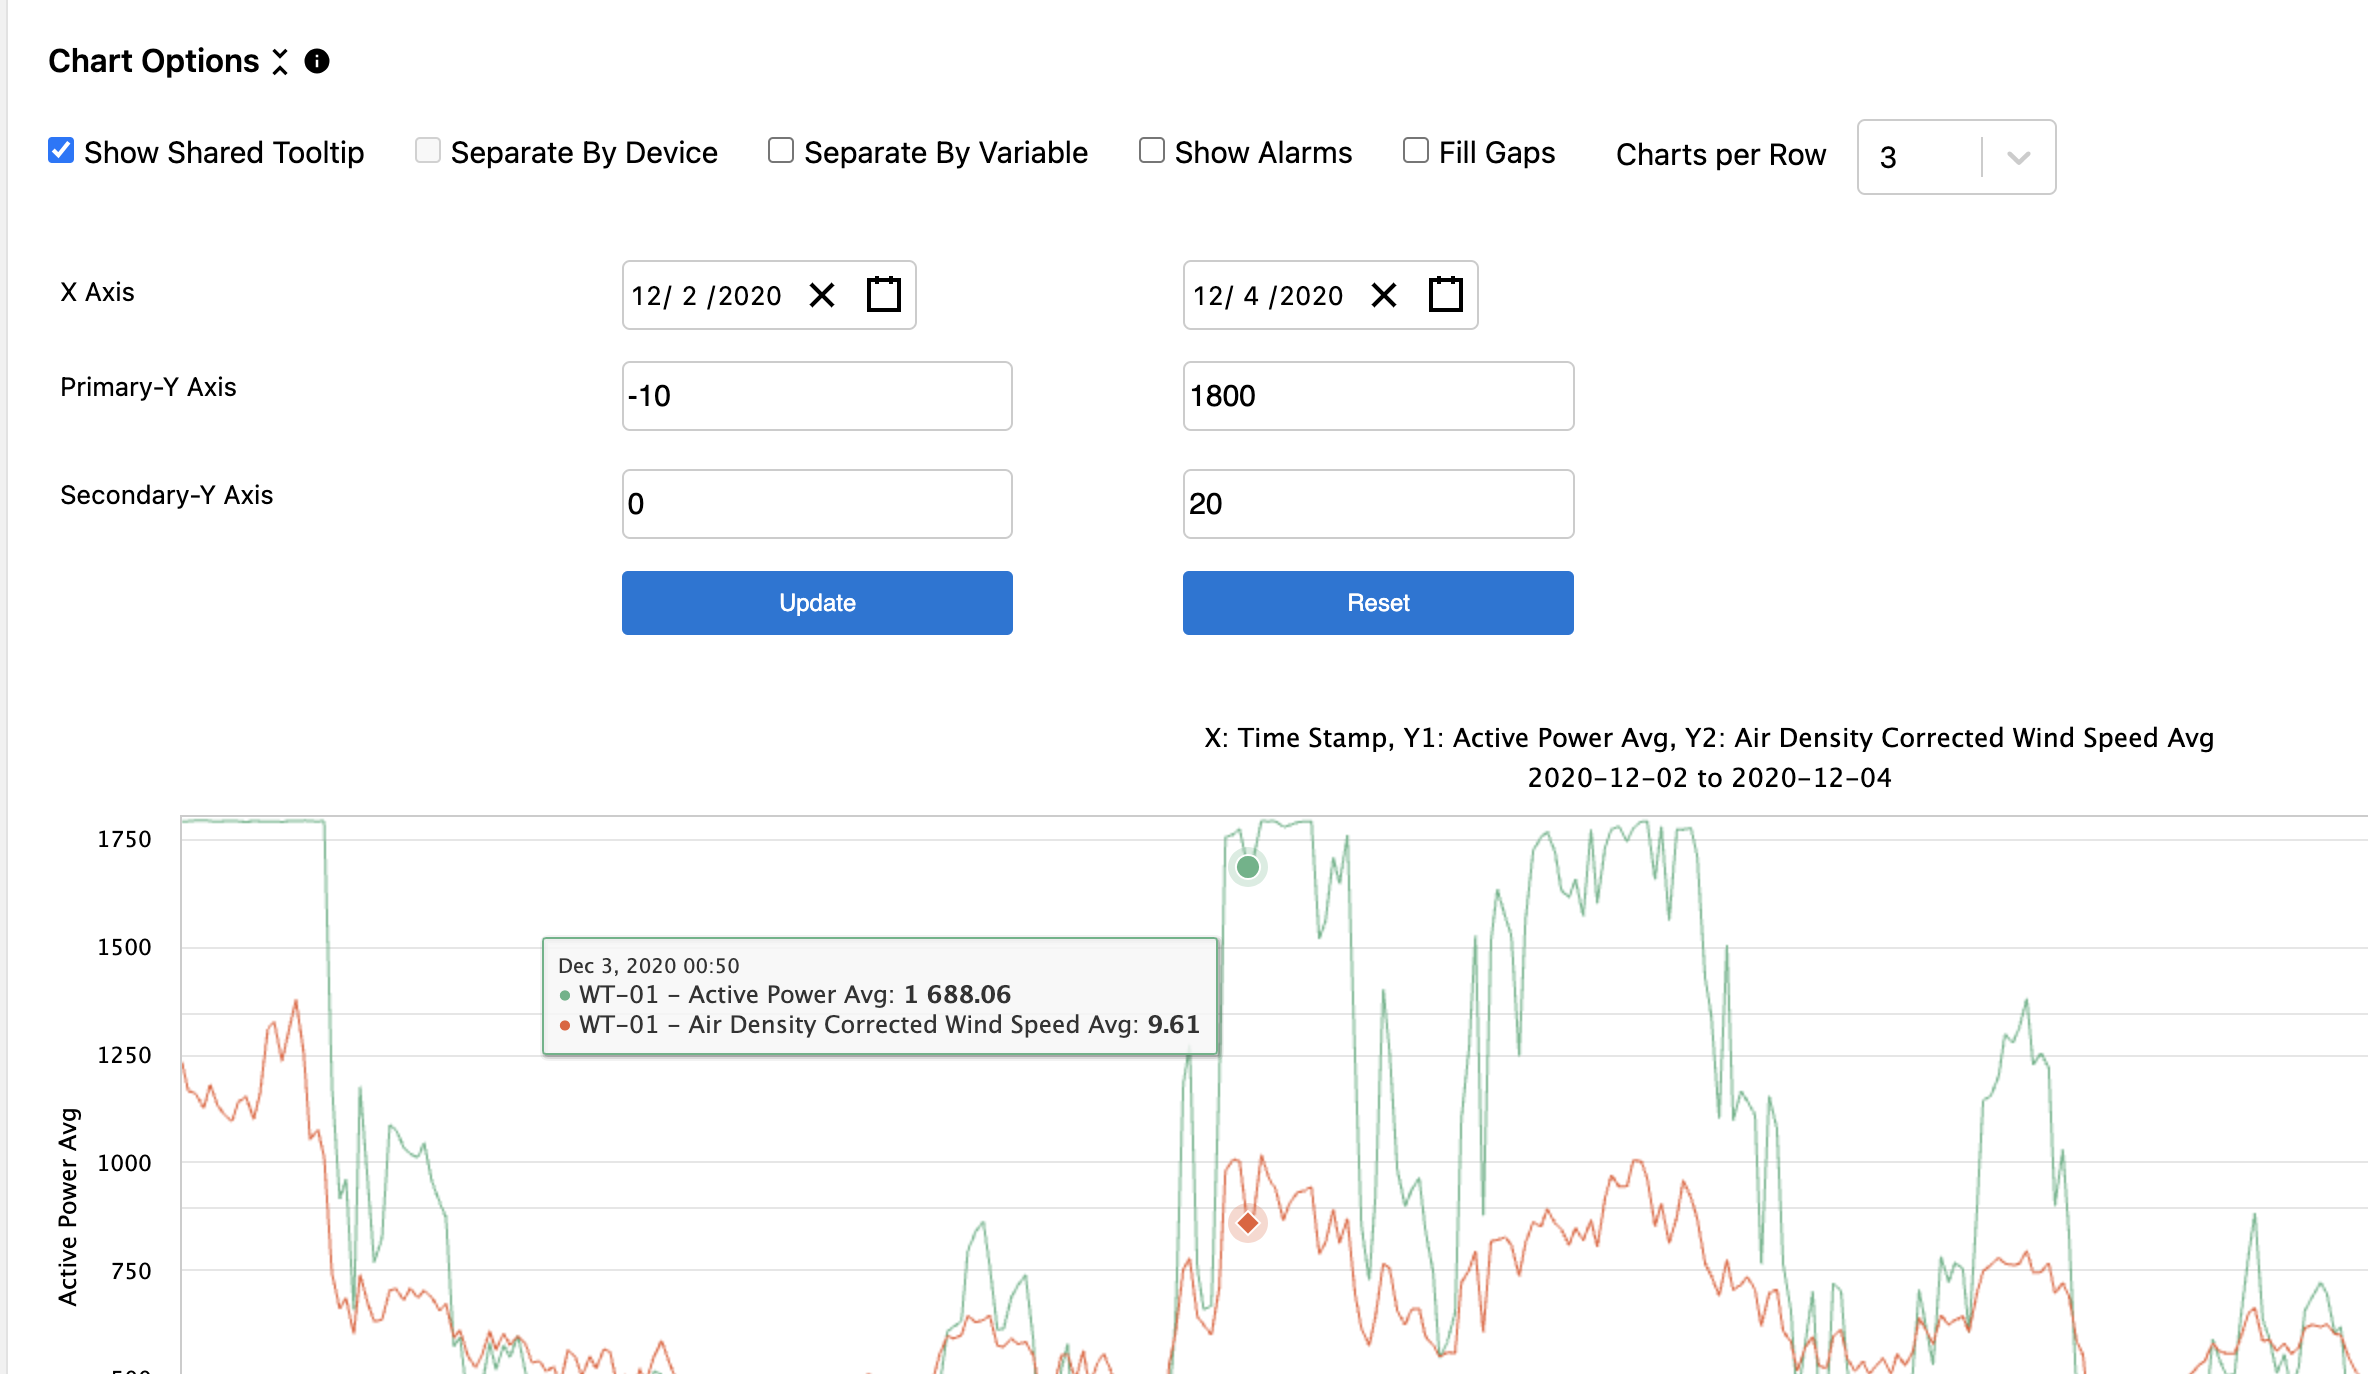
- Enabled a shared tooltip by clicking the checkbox in chart options. This allows you to hover over all lines for that timestamp. The defualt view is to show the value only for the line you are hovering over.
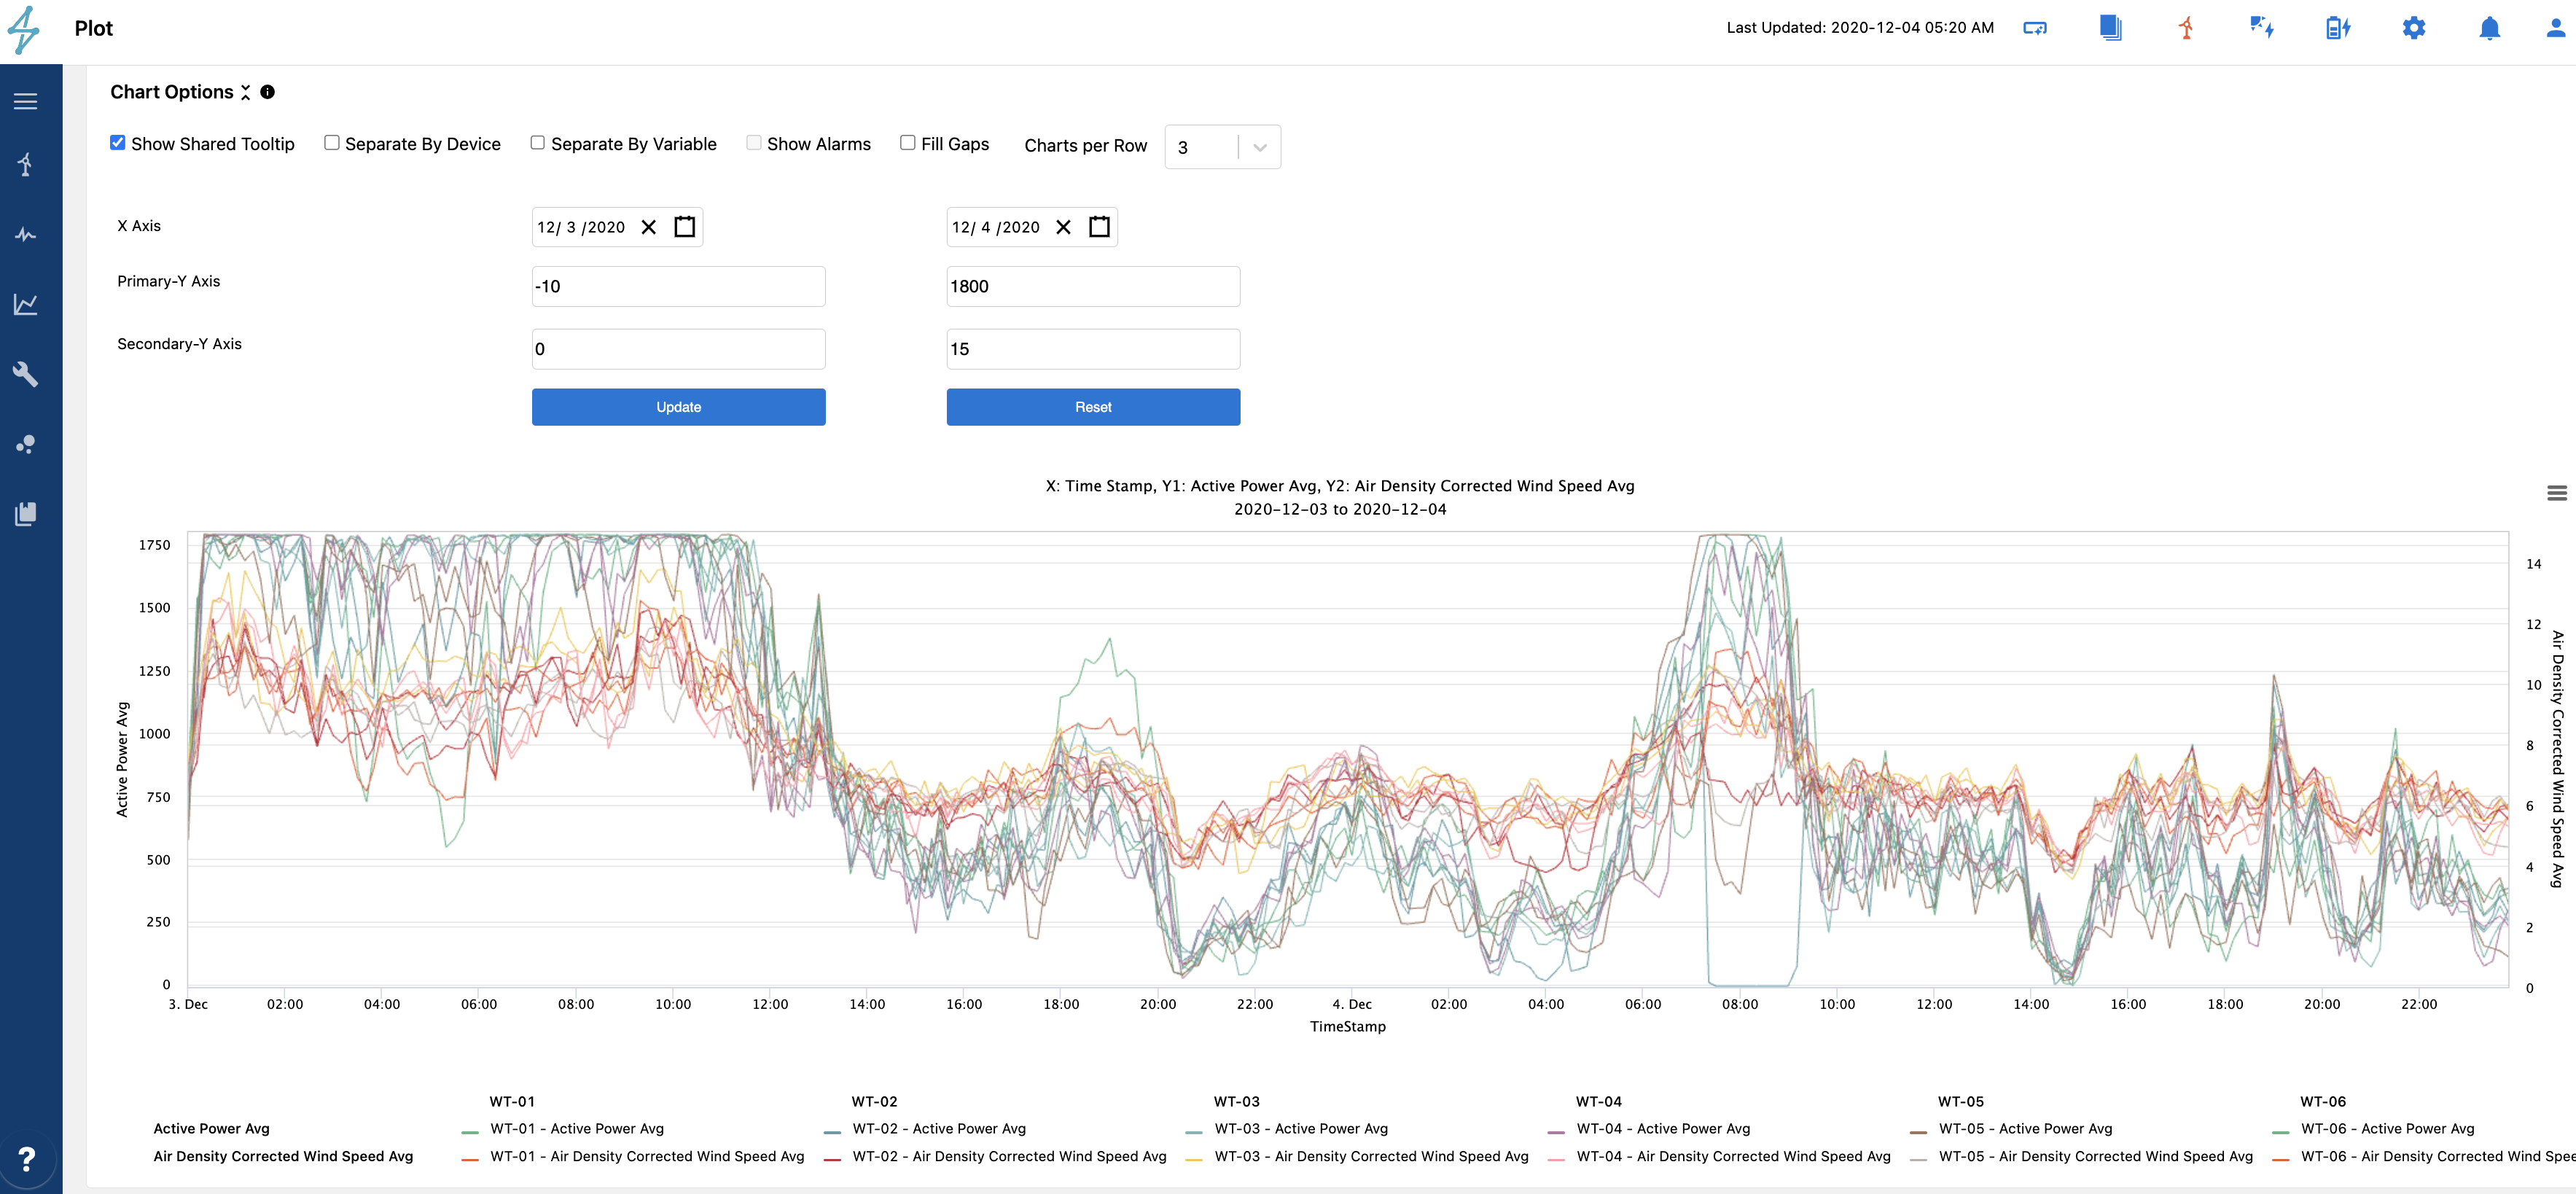
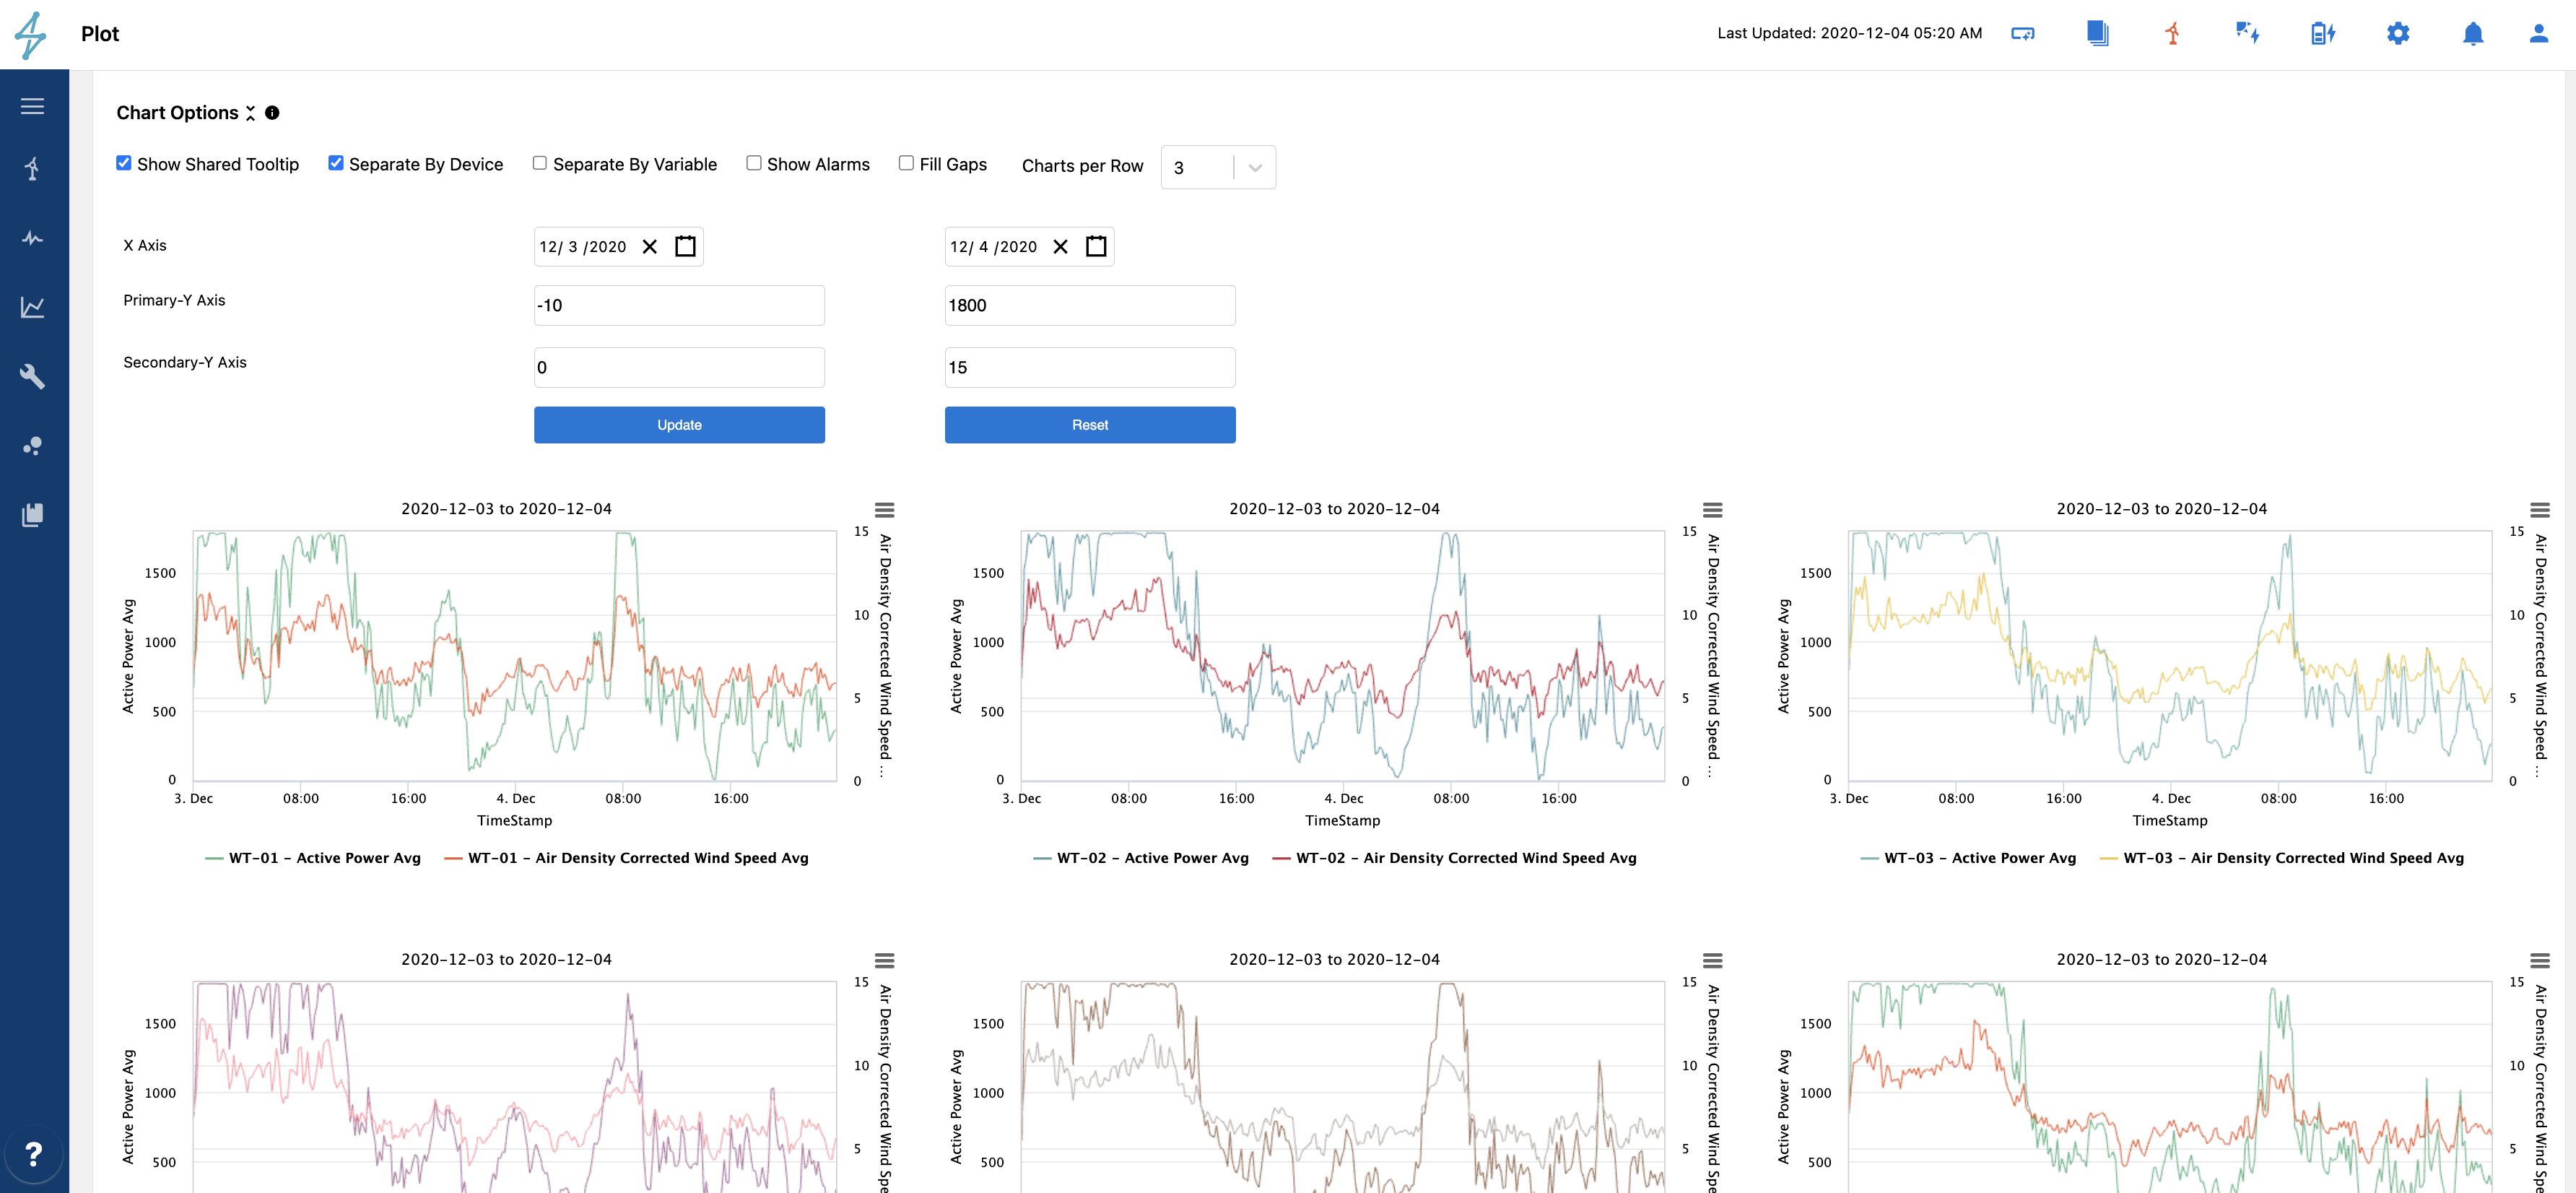
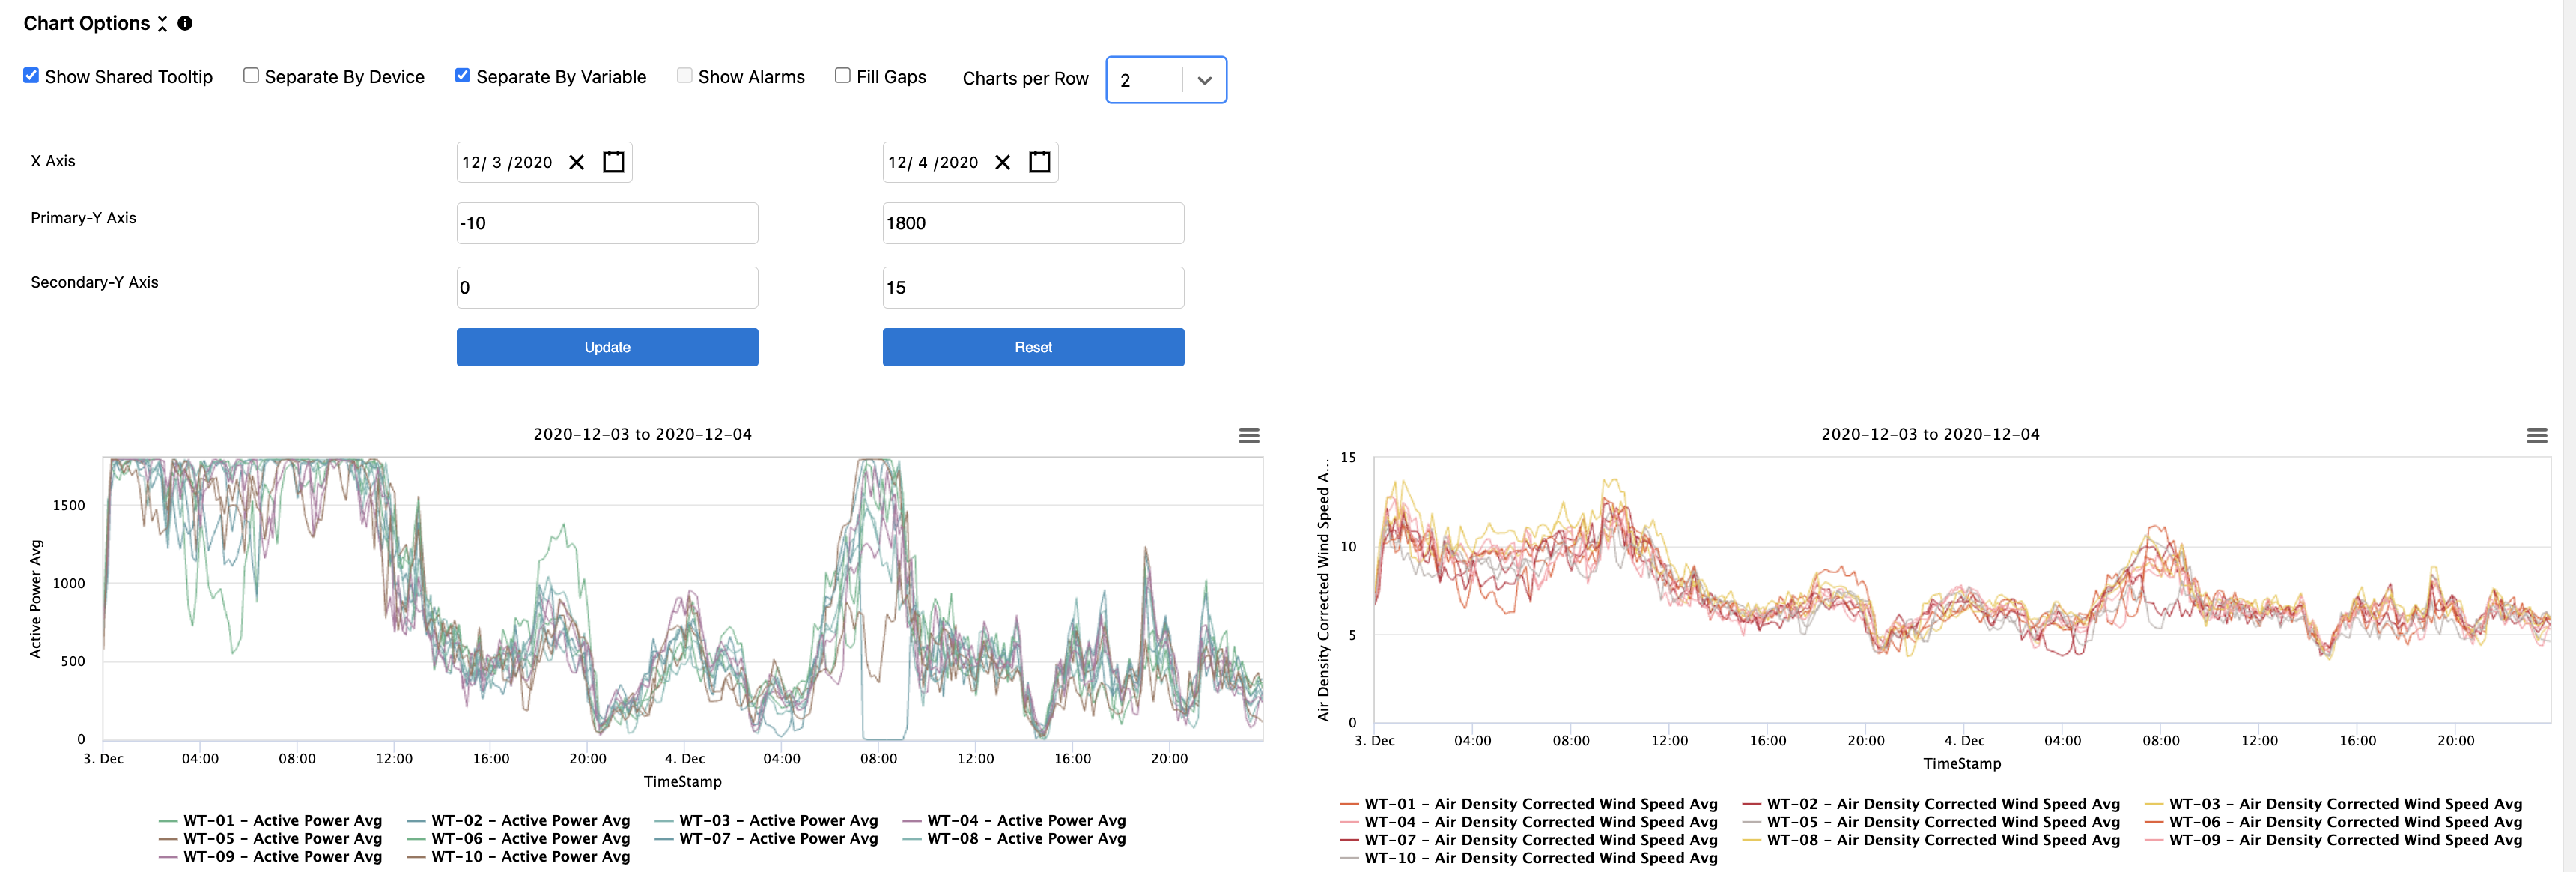
- Separate by Device under chart options allows you to split the charts to have individual charts per device selected. The Charts per Row setting enables you to choose how wide to see these charts to make it easier to dive into the details or see lots at once.
- Separate by Variable under chart options allows you to split the charts to have individual charts per variable selected. The Charts per Row setting enables you to choose how wide to see these charts to make it easier to dive into the details or see lots at once.
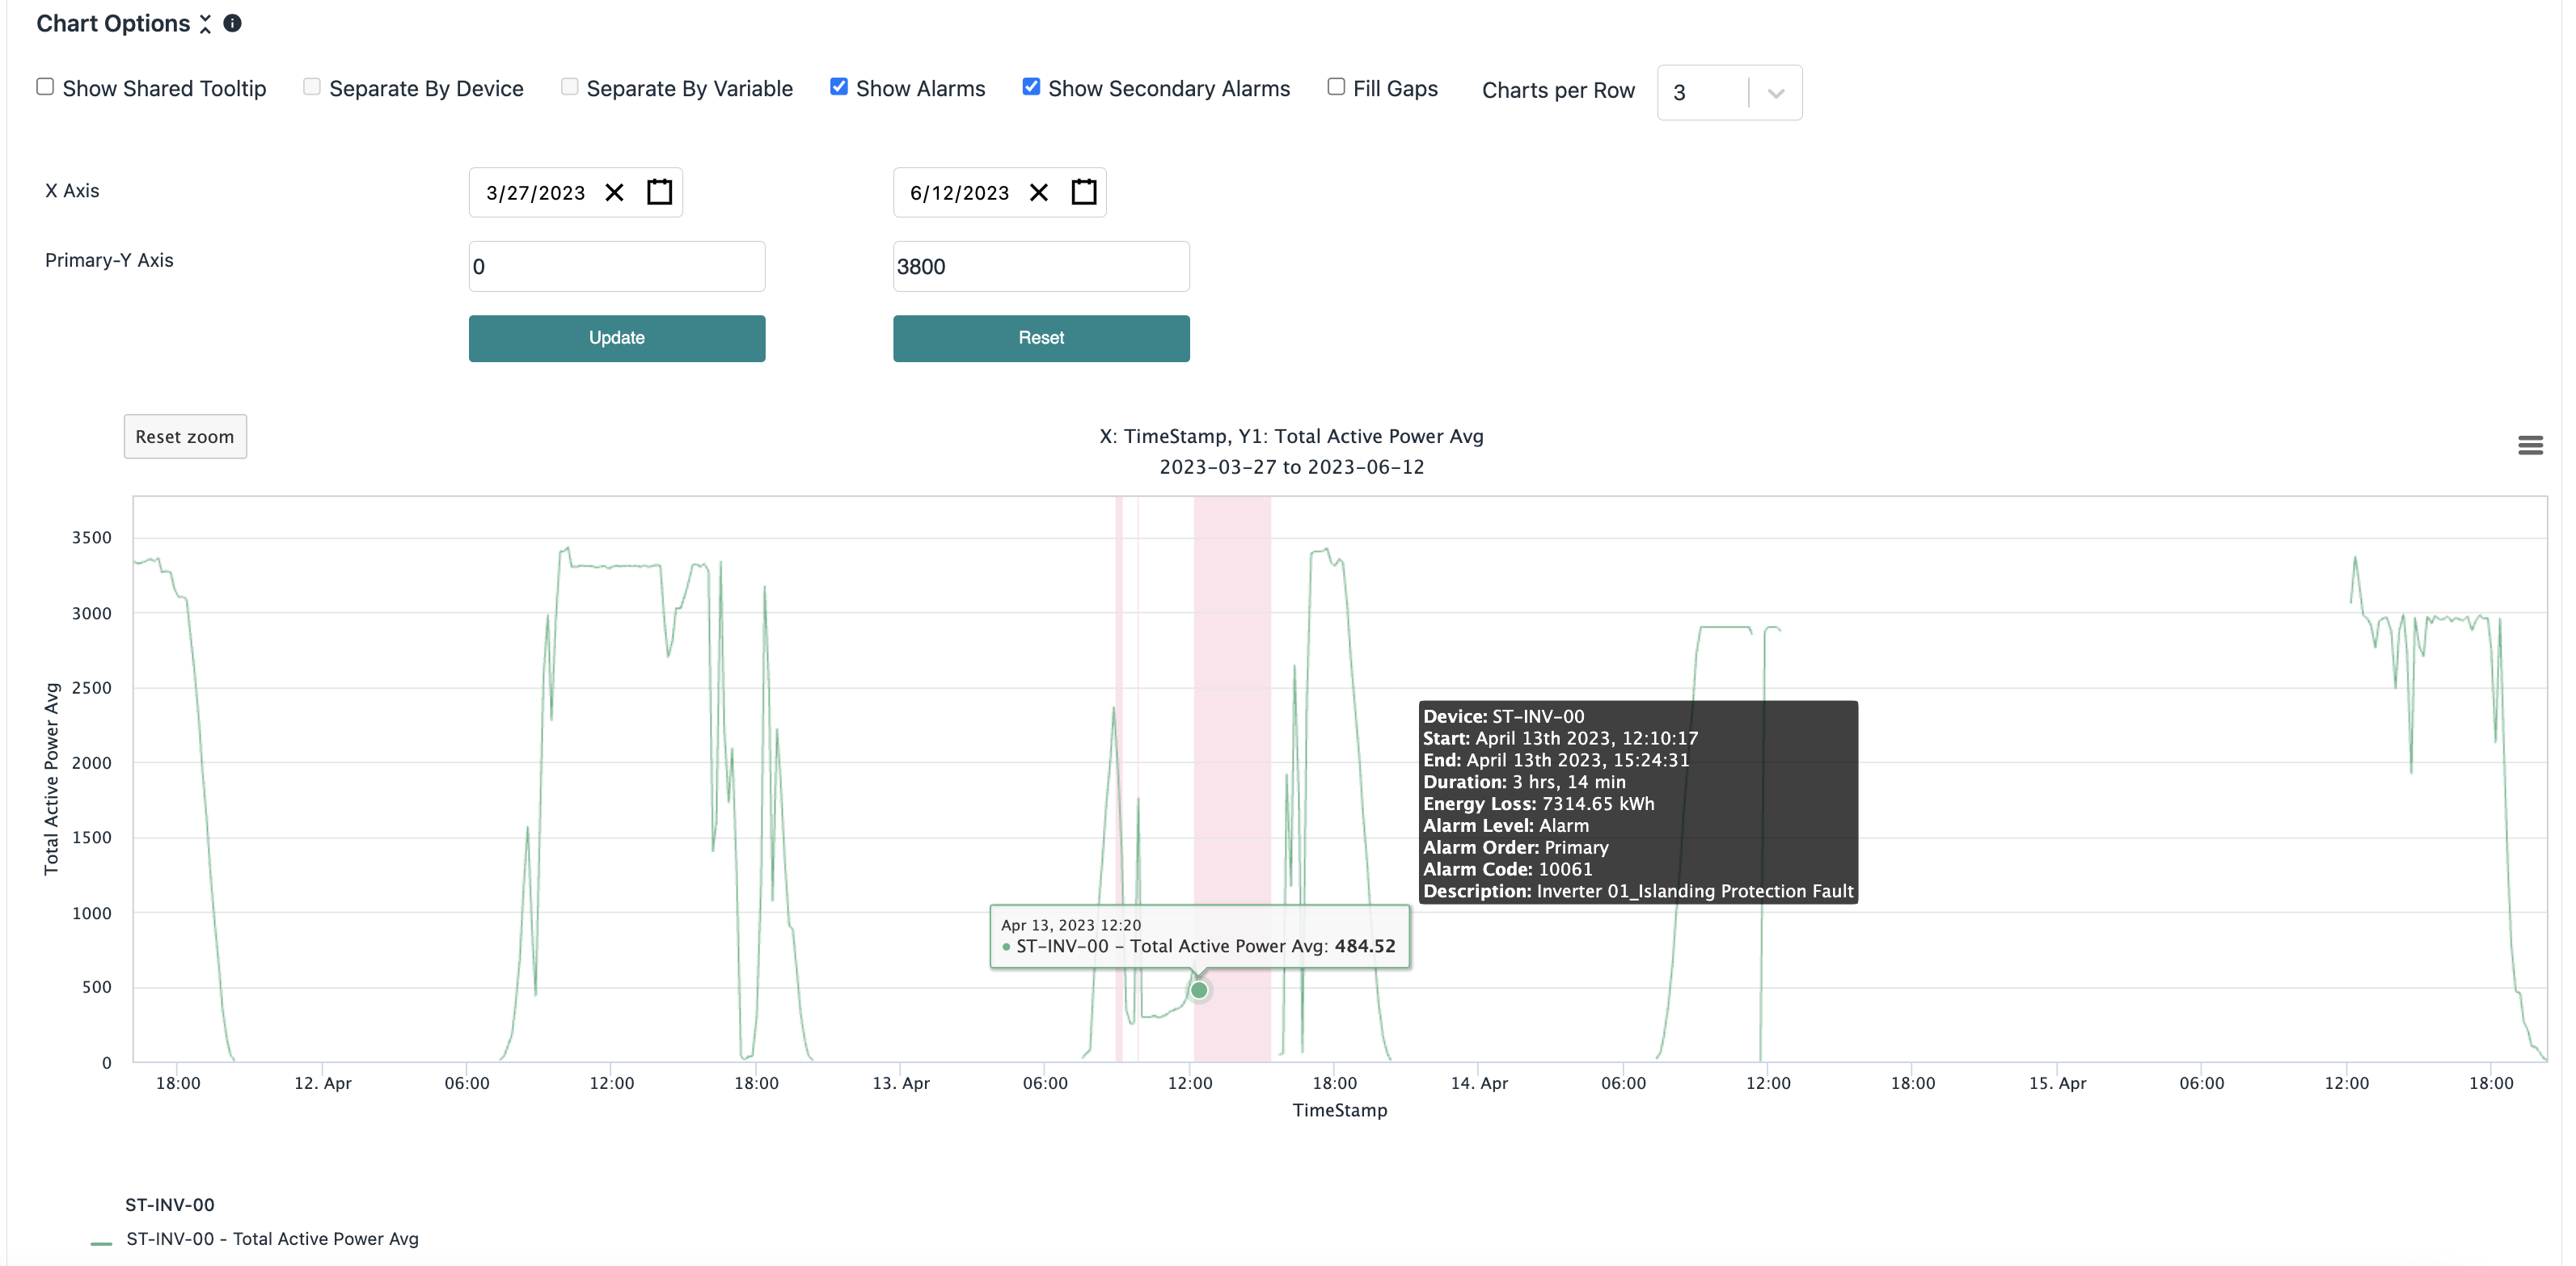
- Show Alarms under chart options enables you to overlay periods with primary or secondary alarms on top of a time series plot. This feature is only available if the x axis is time for a line plot. Once you show alarms, there will appear a second checkbox which lets you show/hide secondary alarms. Primary alarms are shown in red, secondary (which includes curtailment) will be shown in dashed blue). You can hover over the shaded alarm regions to have a tooltip on the alarm details as well. Try moving your mouse around the alarm area if it doesn't show up at first.
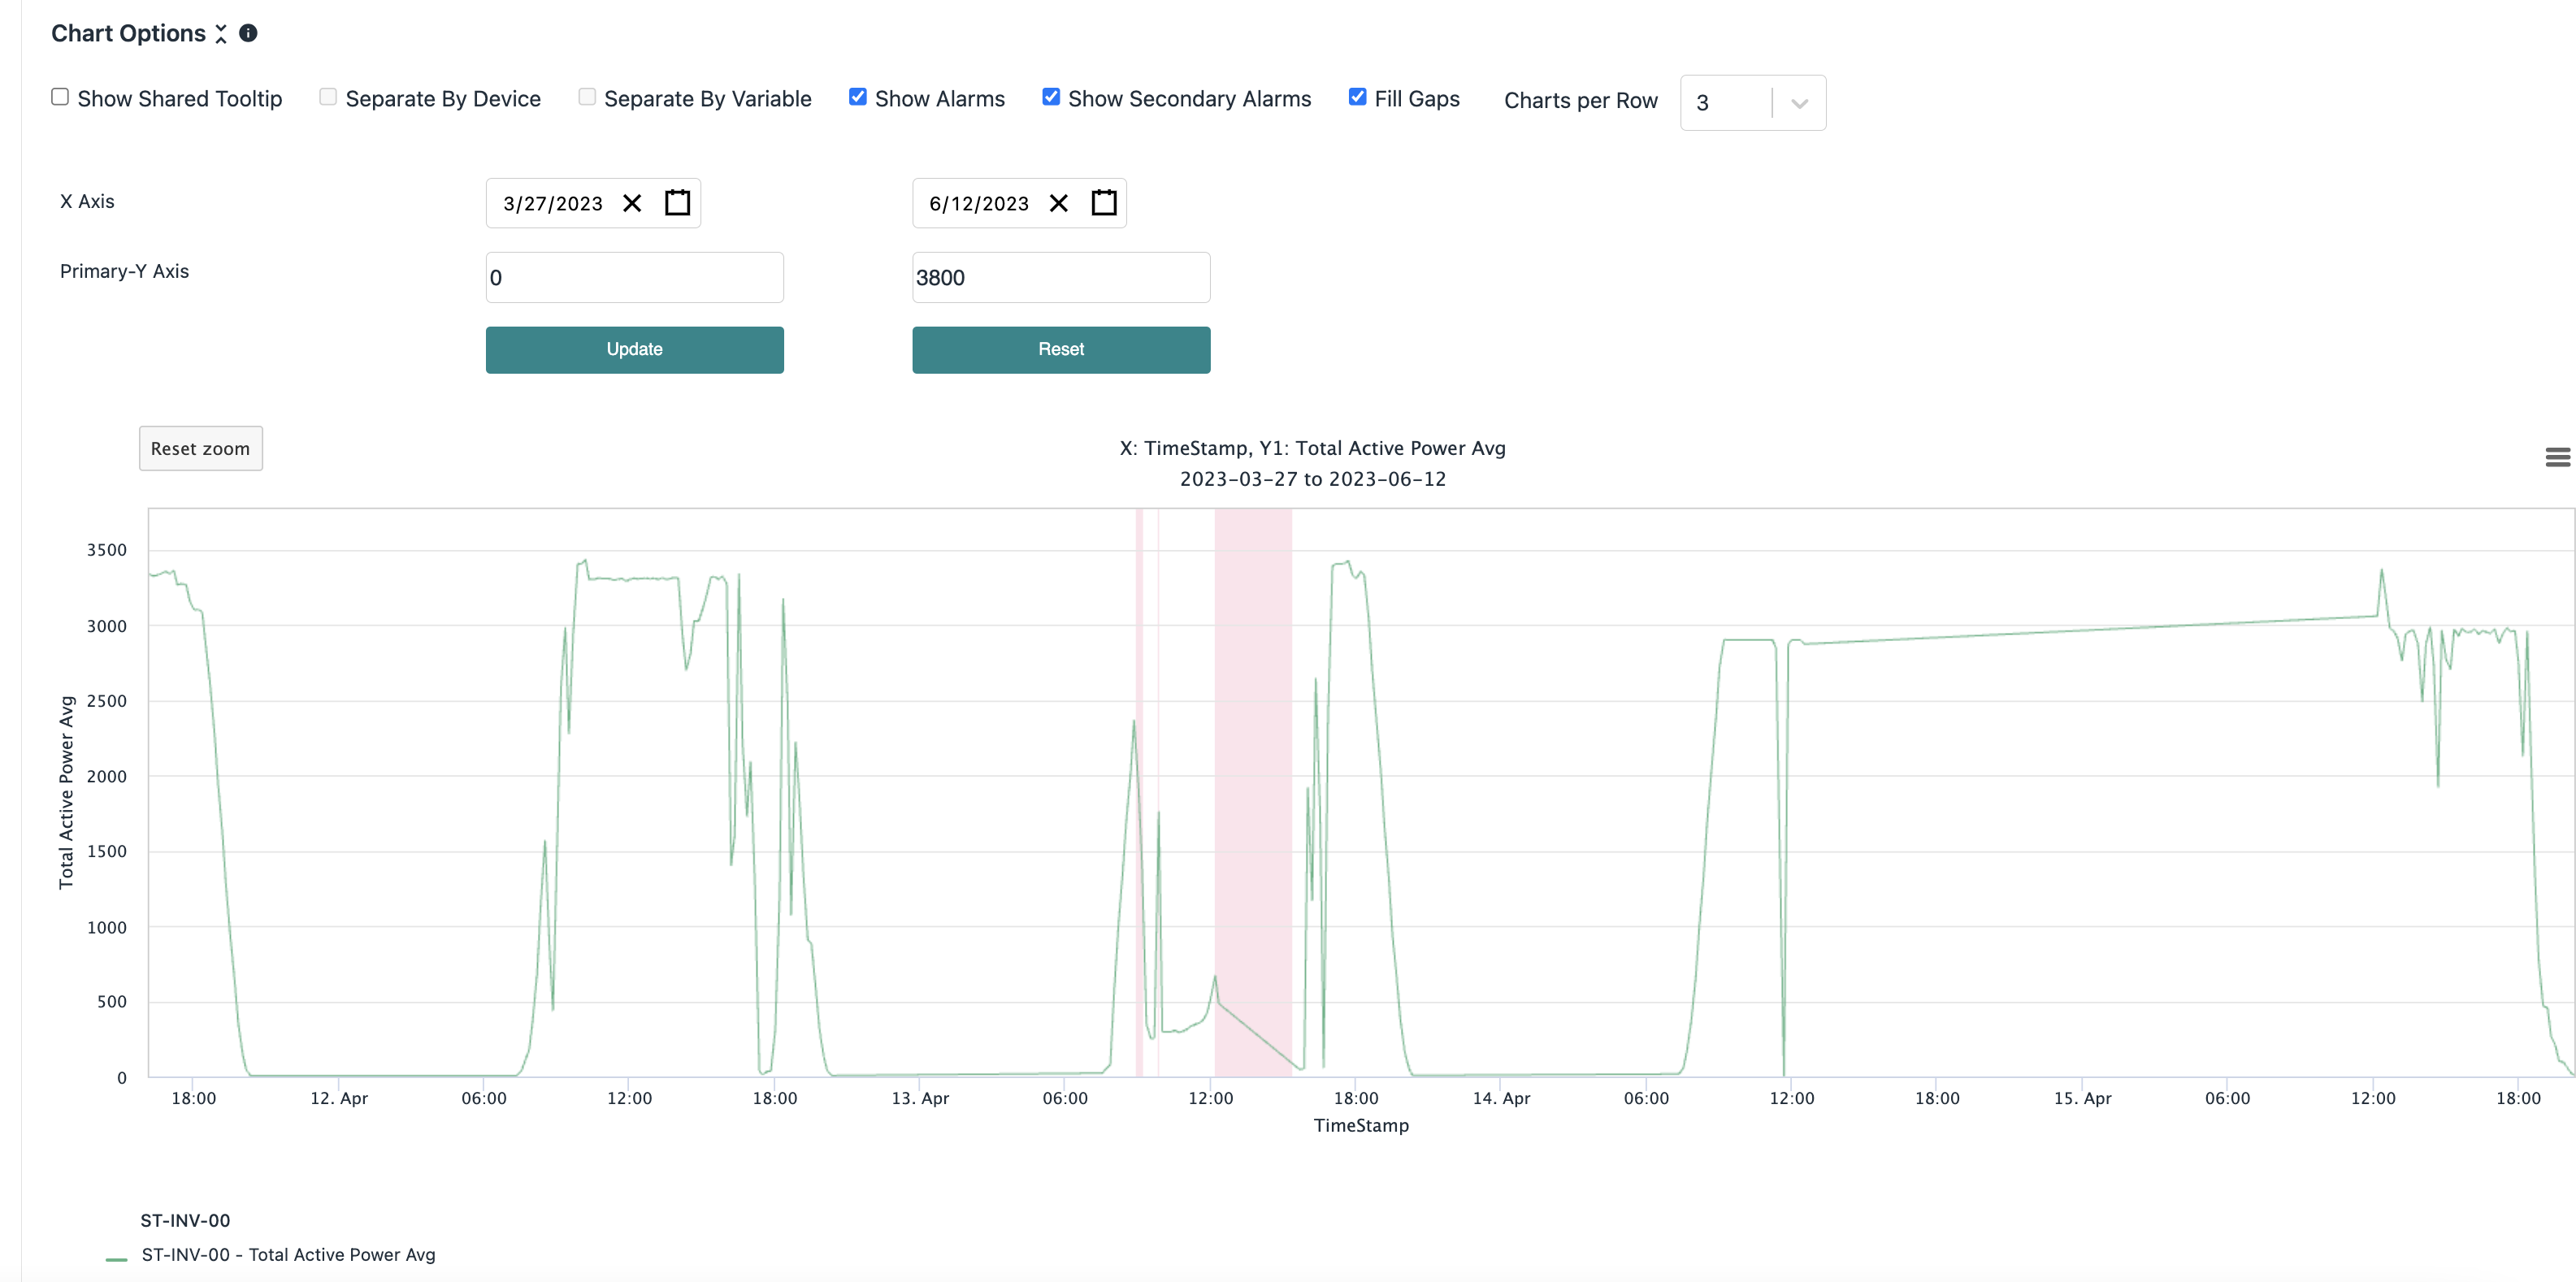
- Fill gaps under chart options allows you to connect two points with a straight line across a data gap. This can make it easier to see one off points on a plot. The tooltip will skip to only show true values. The plot is not interpolating, it is simply connecting the values on either side of a gap with a line.
- X and Y axis settings will enable you to set X, Y1, and Y2 min and max limits for the plot. Note that this is limited to the range that the data was queried for. This can help frame a plot more precisely than the pan and zoom feature. Make sure to click "update" for these settings to take effect. You can always click "reset" to undo these settings. All of these adjustments are done without having to re-query data, so they are fast ways to improve the visualization of a plot.