Budgets/Projections Updated over a week ago
The Renewables Suite platform makes it easy to compare budgeted data with the actual production of an asset during the year. This can be useful for executives, site managers, asset managers, or performance analysts looking to get an idea of how a site is performing versus financially modeled projected energy production numbers. Users can quickly compare key indicators such as budgeted vs. actual production, wind speed, or any other KPI based on the projections data provided during the onboarding process.
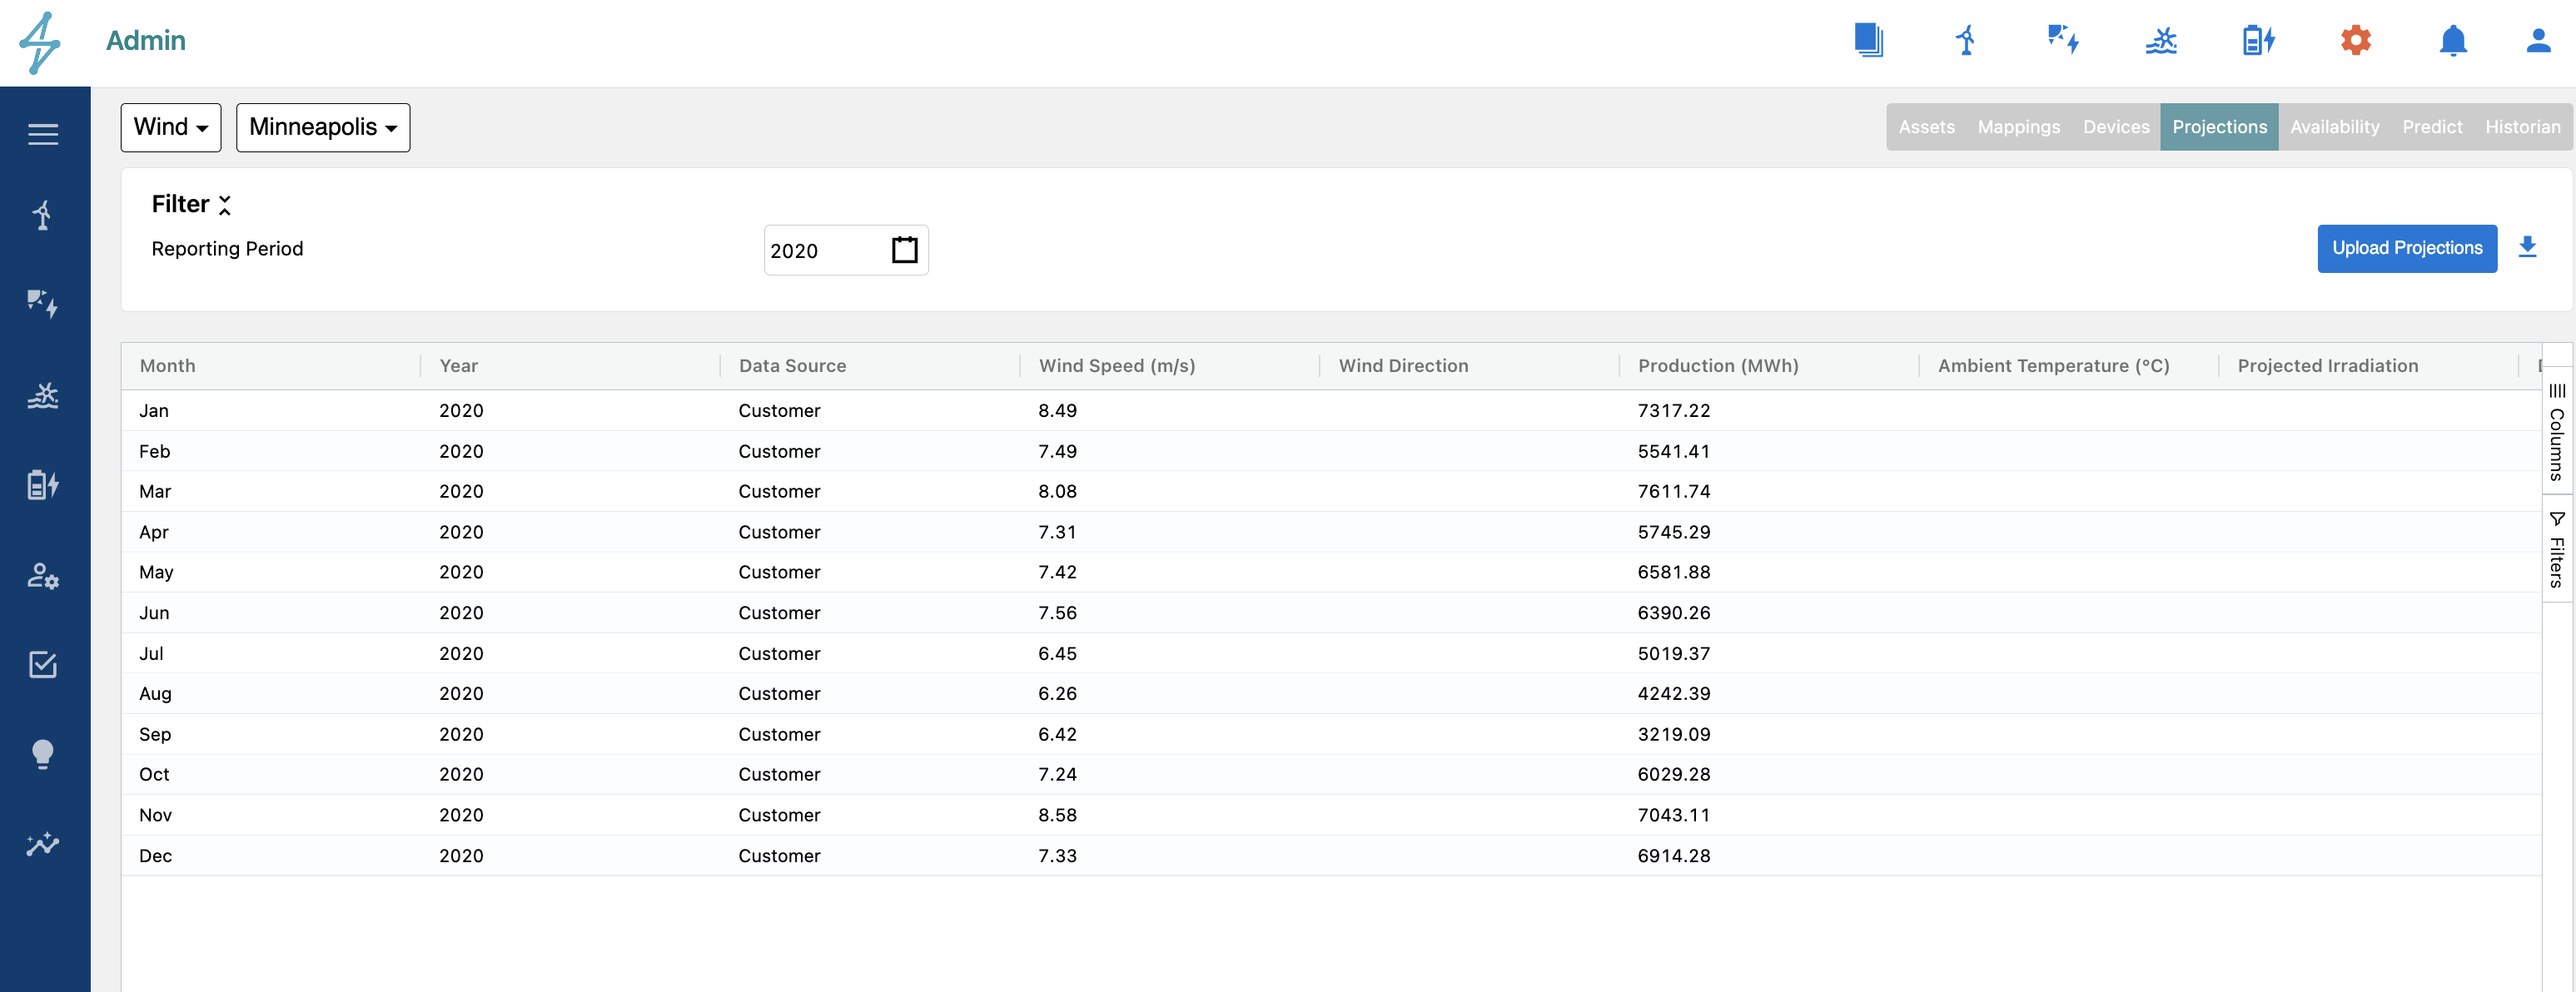
The projected data provided to SparkCognition during Asset onboarding for a given year can be viewed under the Projections tab. To access this, Users must first go to the Admin menu which is the gearbox icon on the top menu bar then they will be able to select the Projections tab.
Apart from monthly projections, if required the Renewables Suite also supports a more detailed hourly (8760) projections format when such information is available at hourly intervals.

Budgeted or Projections Data
