The Asset Performance Table widget allows users to get a quick overview of the project for the selected year to date. The Asset Performance table includes all major KPI's such as Actual vs. Budgeted Energy Production, Wind Speed, Capacity Factor, Alarm and Availability Information etc.
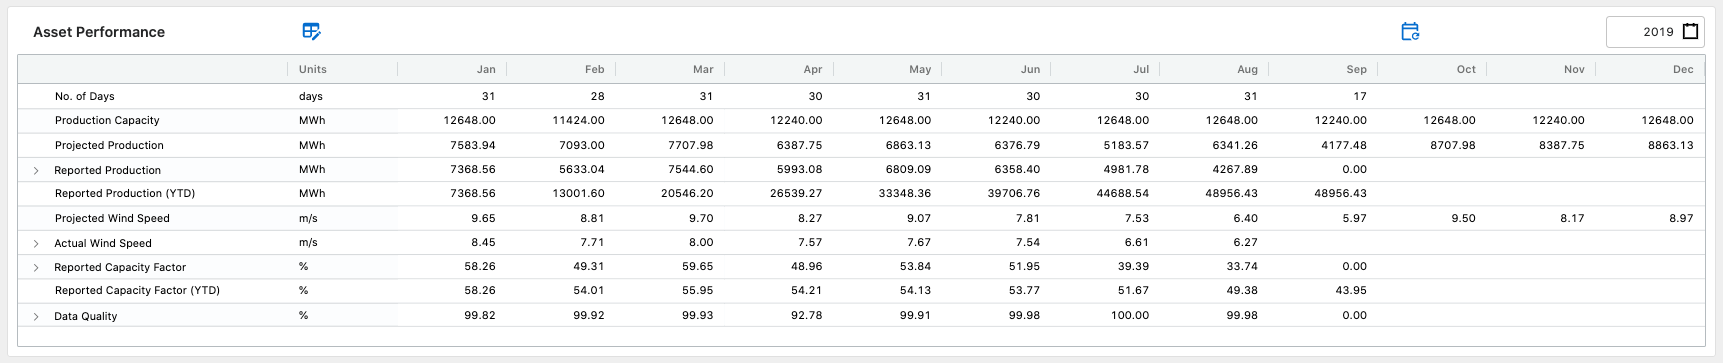
Asset Performance Table
The Asset Performance widget is comprised of over 50 KPI's from various categories such as Performance, Alarm and Downtime Analysis, Availability Reporting etc. To customize the Asset Performance table click the Edit Icon on top of the table. The edit window opens a popup where users can be re-organize the fields in desired order of display by dragging and reordering the fields. To customize the field name e.g. to change display name of Production Capacity to Possible Max Production simply double click the Custom Field Name cell and enter the desired field name. To show or hide a particular KPI from the UI check or uncheck the Display column. Once done editing click Save and close the popup. This will result in reloading of the table and all changes would be effective immediately.
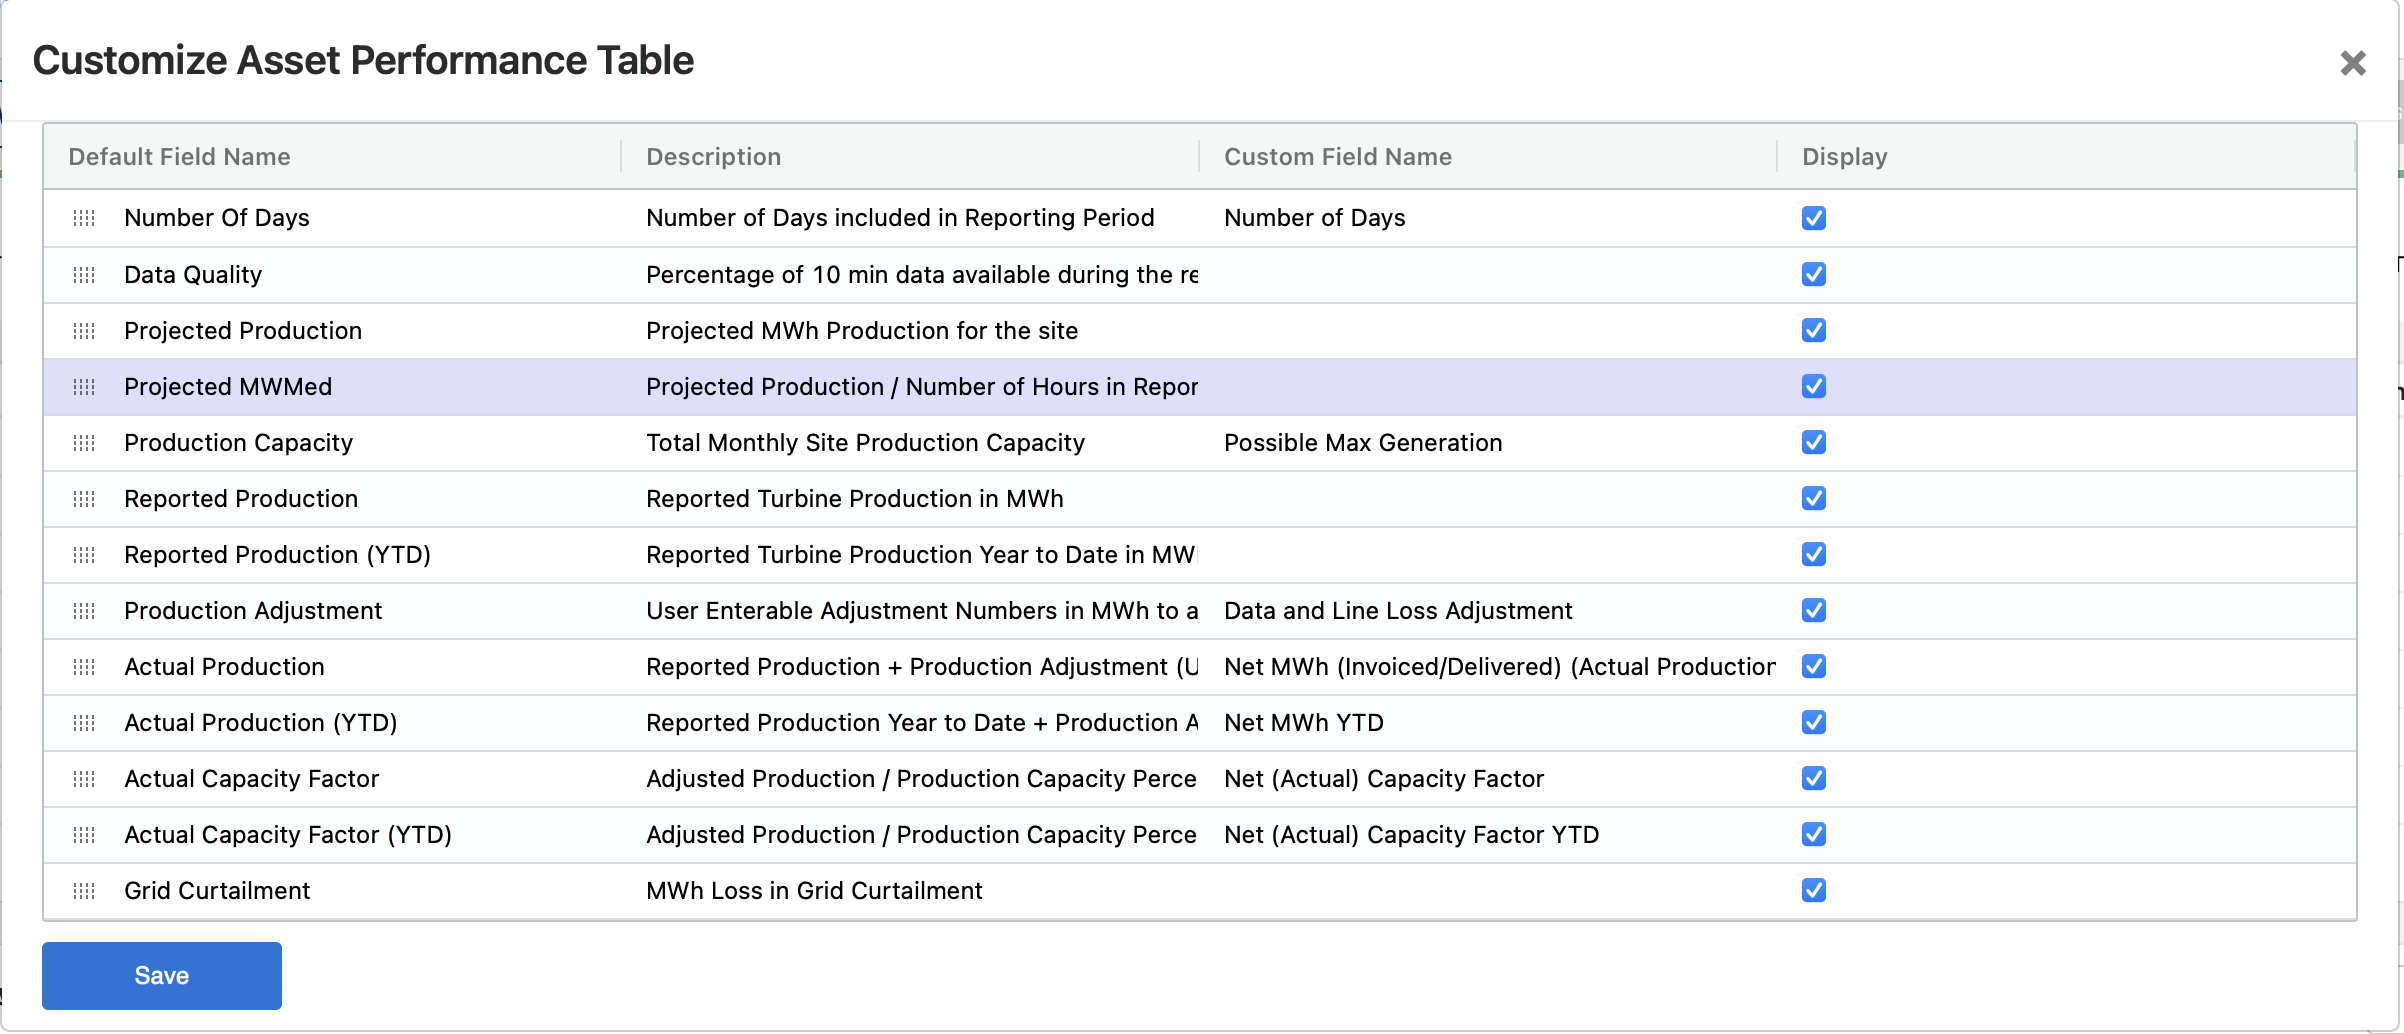
Customize Asset Performance Table
🚧
Asset Level Preference
Any changes made to Customize Asset Performance table are visible to all users across the Asset. Every user at the asset will see any display name or table organization changes. If you are unsure of the settings and need help then reach out to SparkCognition Support team for help with table customization.
General
Number Of Days : Number of Days included in Reporting Period
Projected Wind Speed : Projected Wind Speed in m/s for the site
Actual Wind Speed : Reported Average Wind Speed at Turbine in m/s
Production
Production Capacity : Total Monthly Site Production Capacity
Projected Production : Projected MWh Production for the site
Reported Production : Reported Turbine Production in MWh. Calculated as SUM(Active Power 10min kW)/6000 to get the value in MWh.
Reported Production (YTD) : Reported Turbine Production Year to Date in MWh
Production Adjustment :Adjustment Numbers in MWh to account for Data and Line Loss etc. Automatically calculated based on Site Meter or user enterable field if meter information is unavailable.
Actual Production :Reported Production + Production Adjustment (Use negative adjustment to reduce)
Actual Production (YTD) :Reported Production Year to Date + Production Adjustment Year to Date
Gross Production :Adjusted Production + Total Curtailment where Total Curtailment includes Grid, Environmental and other curtailments. If the curtailment module is disabled then these values are not auto calculated.
Gross Production (YTD) :Adjusted Production YTD + Total Curtailment Year to Date
Actual Production MWMed :Actual Production / Number of Hours in Reporting Period
Actual Production MWMed (YTD) :Actual Production Year to Date / Number of Hours Year to Date
Gross Production MWMed :Gross Production / Number of Hours in Reporting Period
Gross Production MWMed (YTD) :Gross Production Year to Date / Number of Hours Year to Date
Projected MWMed :Projected Production / Number of Hours in Reporting Period
Curtailment
Grid Curtailment :MWh Loss in Grid Curtailment
Environmental Curtailment :MWh Loss in Environmental Curtailment
Wind Direction Curtailment :MWh Loss in Wind Direction Curtailment
Total Curtailment :Grid + Environmental + Wind Direction Curtailment
Total Curtailment Percentage :Total Curtailment / Gross Production
Capacity Factor
Projected Capacity Factor : Projected Capacity Factor for the site (Projected Production / Production Capacity)
Reported Capacity Factor : Reported Capacity Factor (Reported Production / Production Capacity) Percentage
Reported Capacity Factor (YTD) : Reported Capacity Factor Year to Date (Reported Production / Production Capacity) Percentage
Actual Capacity Factor : Adjusted Production / Production Capacity Percentage
Actual Capacity Factor (YTD) : Adjusted Production / Production Capacity Percentage Year to Date
Gross Capacity Factor : Gross Production / Production Capacity Percentage
Gross Capacity Factor (YTD) : Gross Production / Production Capacity Percentage Year to Date
Availability Adjusted Gross CF : (Gross Capacity Factor/Technical EBA)/BOP Availability
Alarm/Event Summary
Total Alarm Duration : Total Alarm Duration of Unavailable Alarms (Excludes Warnings and Logs)
Total Alarm Count : Total Alarm Frequency of Unavailable Alarms (Excludes Warnings and Logs)
Mean Time to Resolve Alarm : Mean Time to Resolve Unavailable Alarms (Excludes Warnings and Logs)
Mean Time Between Alarms : Mean Time Between Unavailable Alarms (Excludes Warnings and Logs)
Availability
Projections : Admin > Assets > Wind > Projections
Projected BOP Availability : Projected BOP Availability for the site taken from yearly projections data for the site.
Projected Device Availability : Projected Device Availability for the site taken from yearly projections data for the site.
Availability : Admin > Assets > Wind > Availability
Total Reference Energy : Total Estimated Production based on nearby turbines under same operating conditions. Renewables Suite supports alternative methods such as ML based or as mandated by OEM contracts for the reference energy calculations. To learn more about calculations please review Availability
Time Based Availability :Percentage of Time when Turbines were Available for Operations. This is calculated by taking excluding the Alarms marked with Available = FALSE (Unavailable) on Alarms module. Thus, if out of a 10 minute reporting period there was an unavailable alarm for 2 minutes then we will mark the TBA for that 10minute duration as 80%. The overall TBA number is an aggregation of TBA values at each 10 minute interval.
Energy Based Availability :Contractual Energy Based Availability Percentage. Customers can choose if they want Production or Reference Energy based EBA for reporting which are calculated as below:
Reference Energy based EBA (Contractual) =
(Reference Energy - Energy Loss)*100/Reference Energy
Production based EBA (Contractual) =
(Reported Production * 100)/(Reported Production + Energy Loss)
Lost Production Time :Total Production Time - Total Duration of Unavailable Alarms
Total Contractual Energy Loss :Total of Time Based Availability Percentage x Reference Energy
Data Quality : Percentage of 10 min data available during the reporting period
BOP Availability : Balance of Plant Availability calculated as
1 - (BOP Energy Loss)/(BOP Energy Loss + Total Production)
where BOP Energy Loss is loss due to any faults having category of BOP or Balance of Plant
Technical EBA : Technical Energy Based Availability calculated as
1 - (Technical Loss)/(Total Production + Technical Loss)
where Technical Loss is Unavailable Loss + Owner Loss + BOP Energy Loss
Unavailable Loss =
Loss due to any faults that are Unavailable or marked with Availability = FALSE
Owner Loss =
Loss due to any faults that are not due to Wildlife stop or BOP and are marked with Availability = TRUE i.e Contractually Available Faults
BOP Energy Loss =
Loss due to any faults having category of BOP or Balance of Plant