The Analyze module provides powerful self-serve analytics capabilities and allows users to gain insights into the behavior and health of their assets. Any SCADA tag can be plotted against any other tag, and multiple devices can be compared to quickly identify abnormal behaviors. With the Analyze module, users can create plots and advanced visualizations using inverter data, met, and site data all in one location. In addition to plotting data, users can also export data using the Analyze module.
The Analyze module has several different tabs each of which will be explained in further detail in its Help Documentation page.
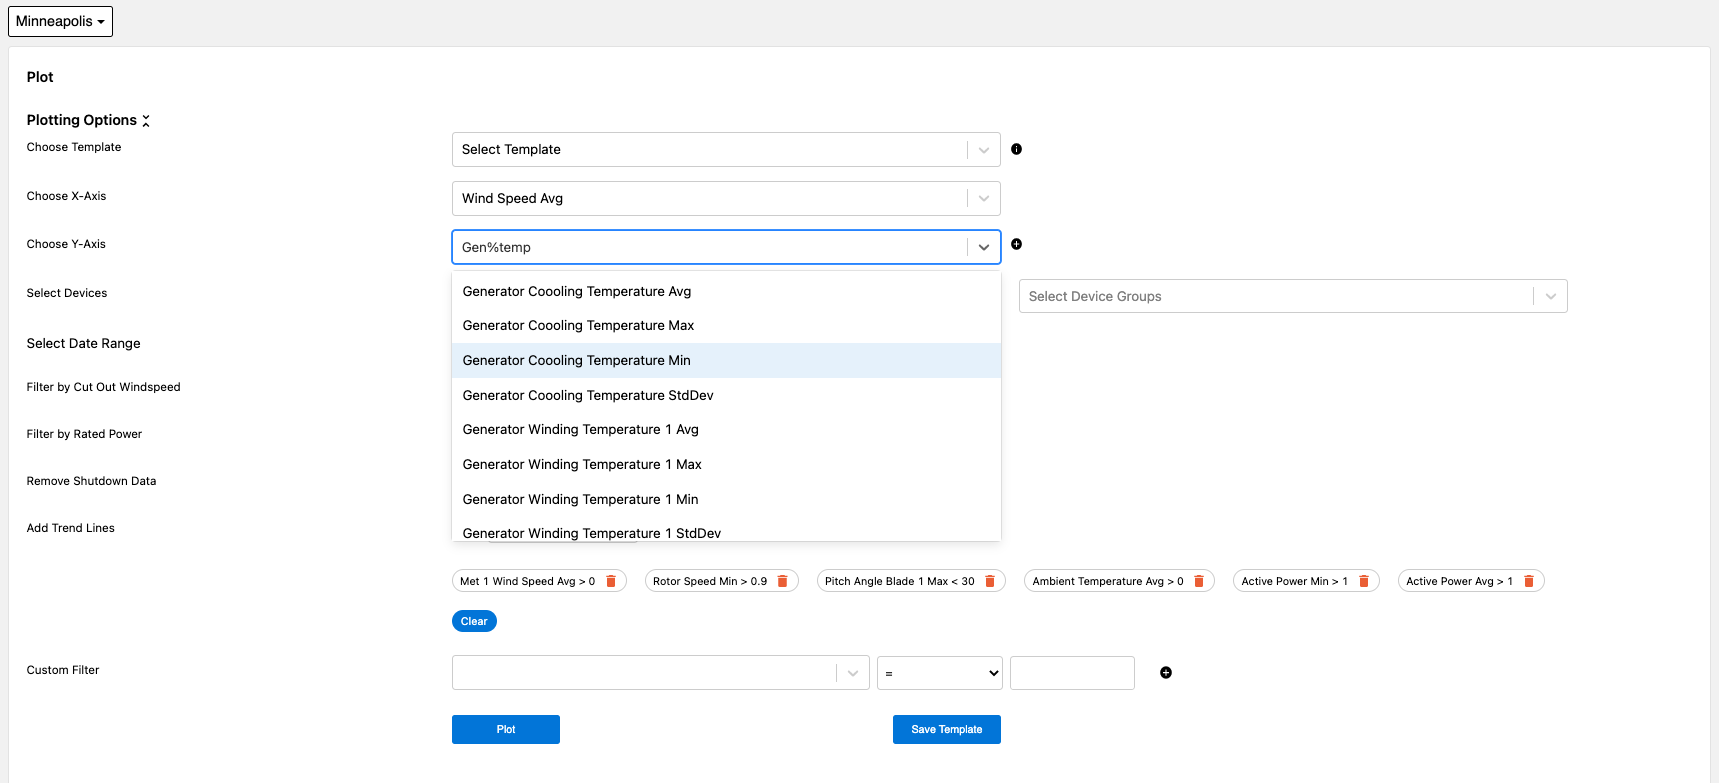
- Plot
- Power Curve
- Data Export
- Visualization
When using the Analyze module, users can use a wildcard search, the percent sign (%), to quickly find specific tag names they are looking to gather data for or visualize through one of the tools available.