Table of contents Alarms Tab Updated over a week ago Table of contents
The alarms tab contains a powerful suite of tools for analyzing fault data. These include tools for quickly visualizing faults in different graphical formats (bar chart, pie chart, waterfall plot) and in different ways (by frequency, duration, or energy loss).
Alarms Tab Video Walkthrough
The short video below shows how to use many of the tools in the alarms tab.
Accessing the Alarms Tab
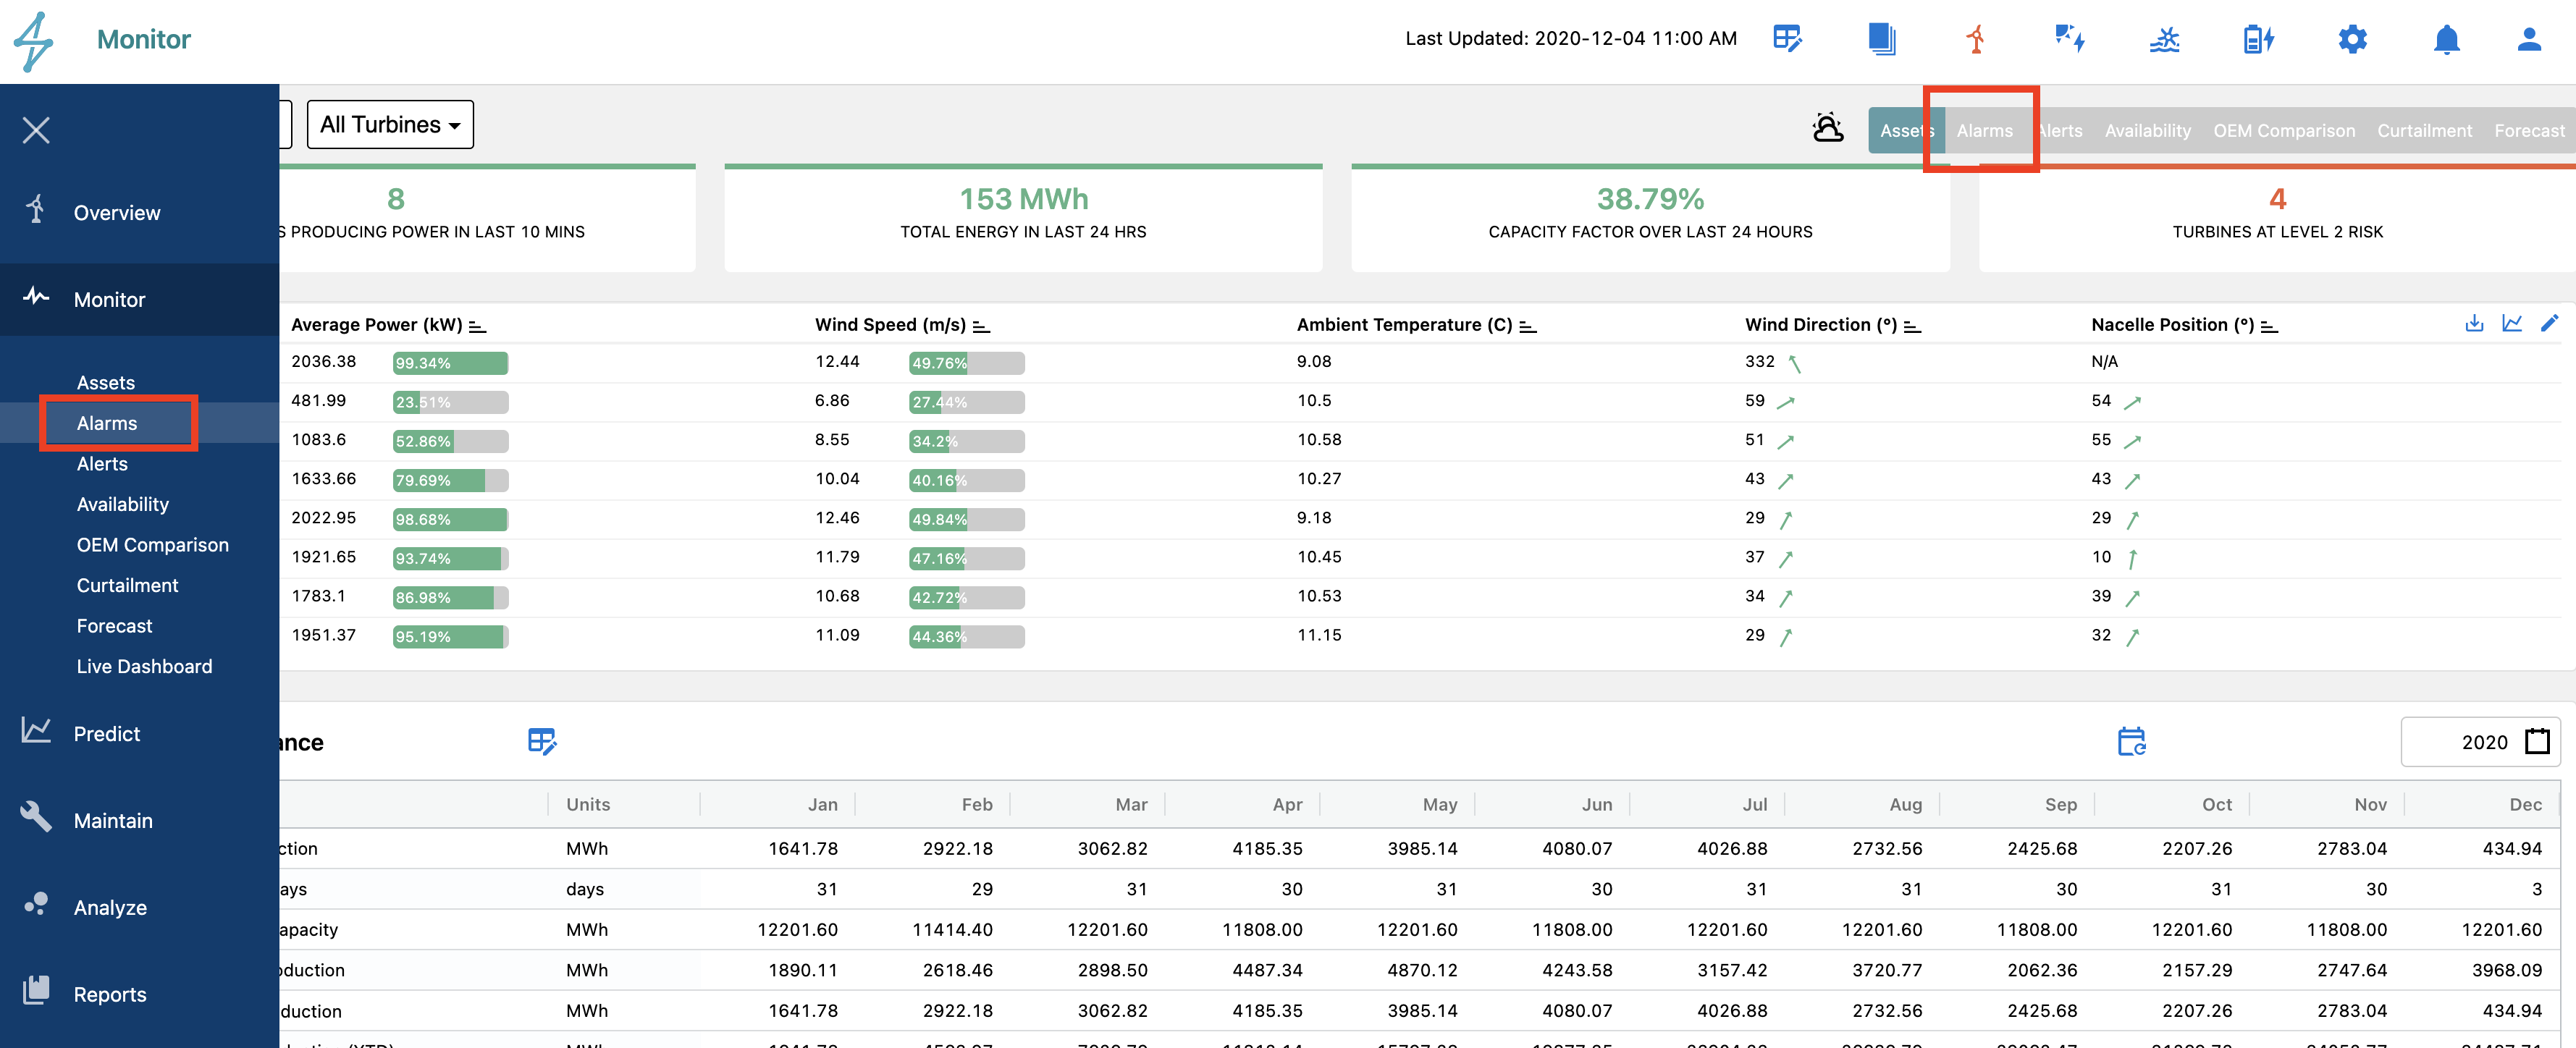
The Alarms Tab is the next tab over from the Asset tab on the top right tab tool bar or the second Tab down below the Assets Tab on the left side toolbar.
Alarms Tab Overview
Once accessing the Alarms Tab users will land on the main alarms overview page for the site. This typically presents alarm information for the previous 30 days.
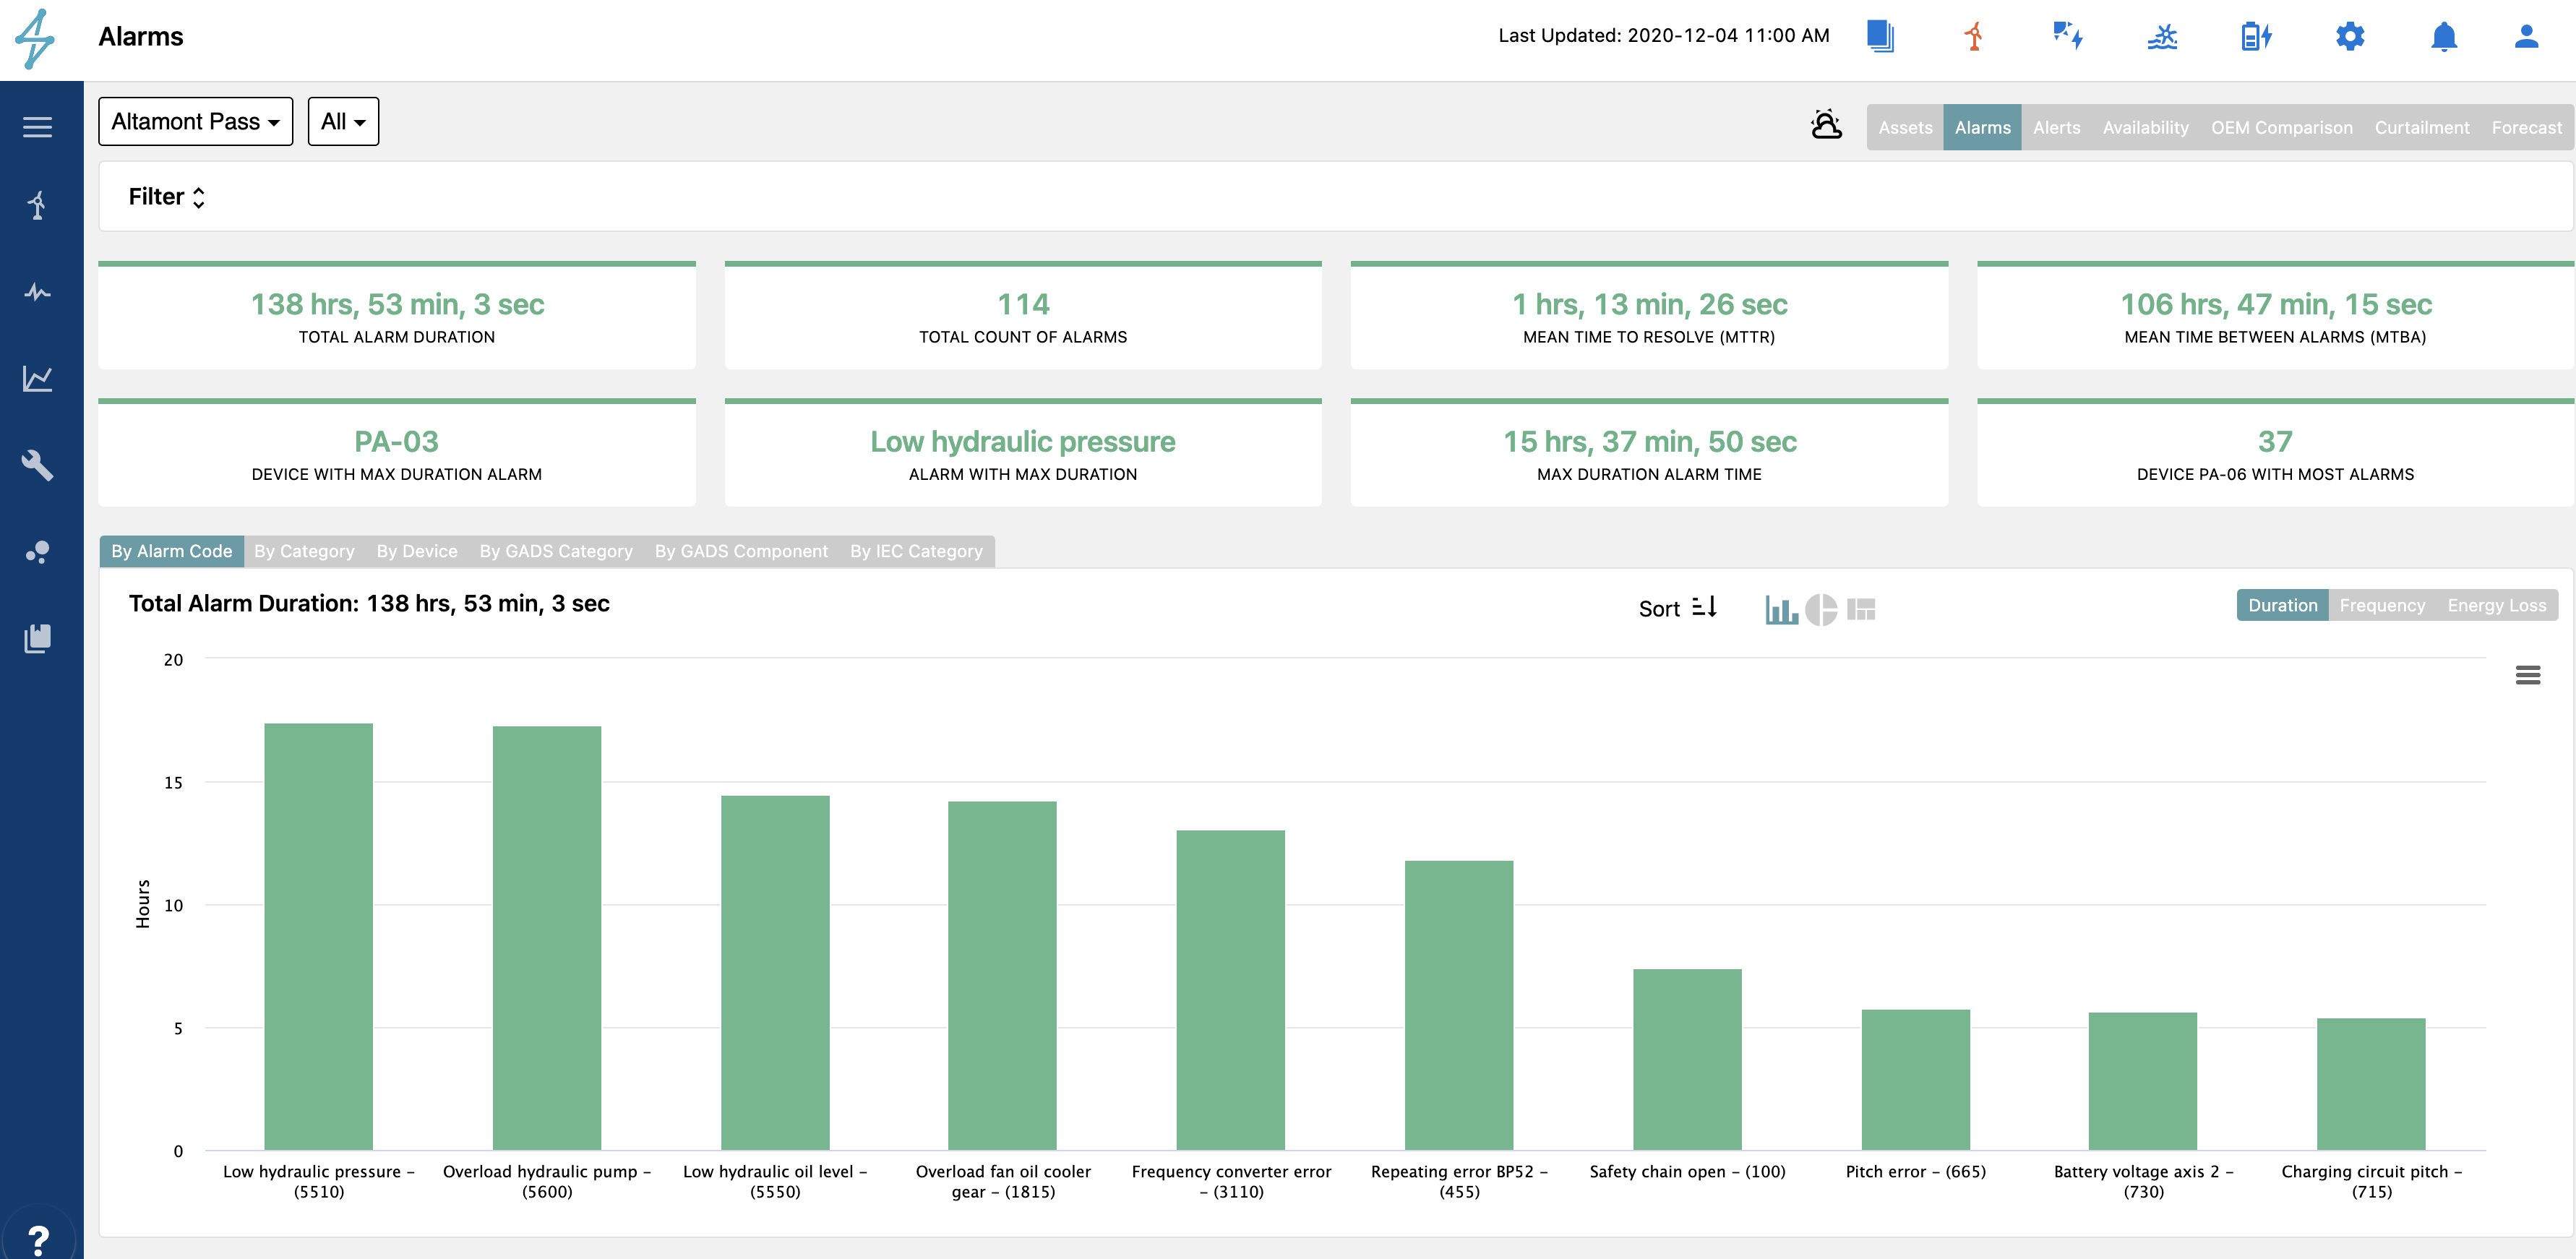
At the top of the view are 8 key indicators from the alarms data that is very helpful in evaluating the most common fault areas and which devices are causing them. This helps to direct focus to certain devices and fault codes to determine a resolution to improve site and device performance.

The operational metrics available to users are:
-
Total Alarm Duration:
-
Total Count of Alarms
-
Mean Time to Resolve (MTTR)
-
Mean Time Between Alarms (MTBA)
-
Device With Max Duration Alarm
-
Alarm With Max Duration
-
Max Duration Alarm Time
-
Device With Most Alarms
Each one allows different insight for that time period, allowing users to identify areas to improve or target for operational improvement.
Total Alarm Duration:
Total Count of Alarms
Mean Time to Resolve (MTTR)
Mean Time Between Alarms (MTBA)
Device With Max Duration Alarm
Alarm With Max Duration
Max Duration Alarm Time
Device With Most Alarms
Each one allows different insight for that time period, allowing users to identify areas to improve or target for operational improvement.
The next view on the page below the operational performance indicators is a visualization of the alarms data. Under this visualization, users have many options to alter the view to show the alarms data in a meaningful way to them.

The interactive graphic can be changed to show alarms by Alarm Code, Category, Device, GADS Category, GADS Component, and IEC Category, depending on what the user is trying to analyze.

Each of these categories can also be visualized as a Bar Chart, Pie Chart, or Heat Map of the associated data as well as by Duration, Frequency, or Energy Loss for each alarm or category selection.
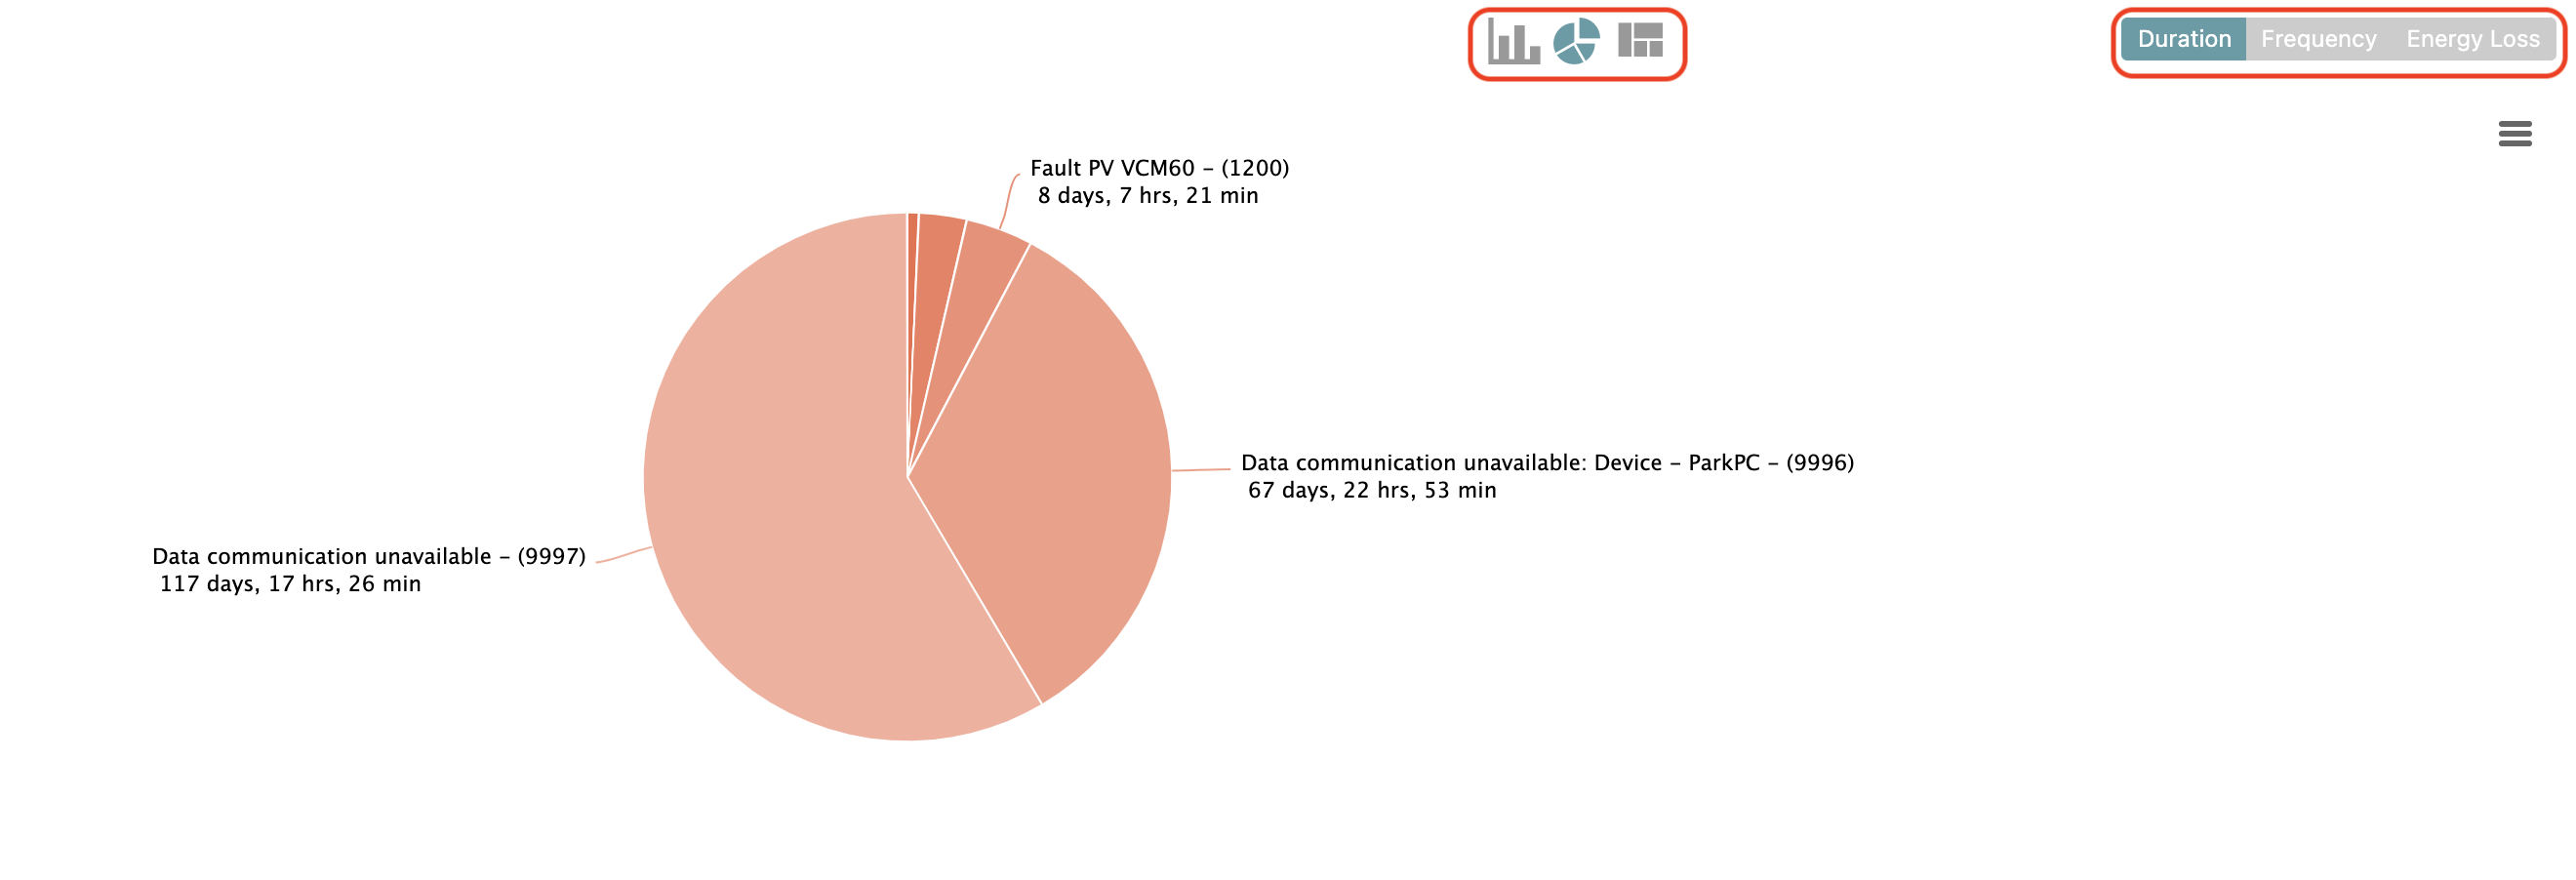
Using these different category selections and visualization methods can be very helpful for determining what alarms/faults are happening the most frequently and what spare parts should be on hand to remediate as well as what faults are causing the most lost energy to hone in on best operational practices to reduce the associated downtime.

Below the alarms visualizations is a table of all the alarms during the specific time period being viewed. Alarms can be filtered by the categories on the top of the columns or on the right side using the filter toolbar.
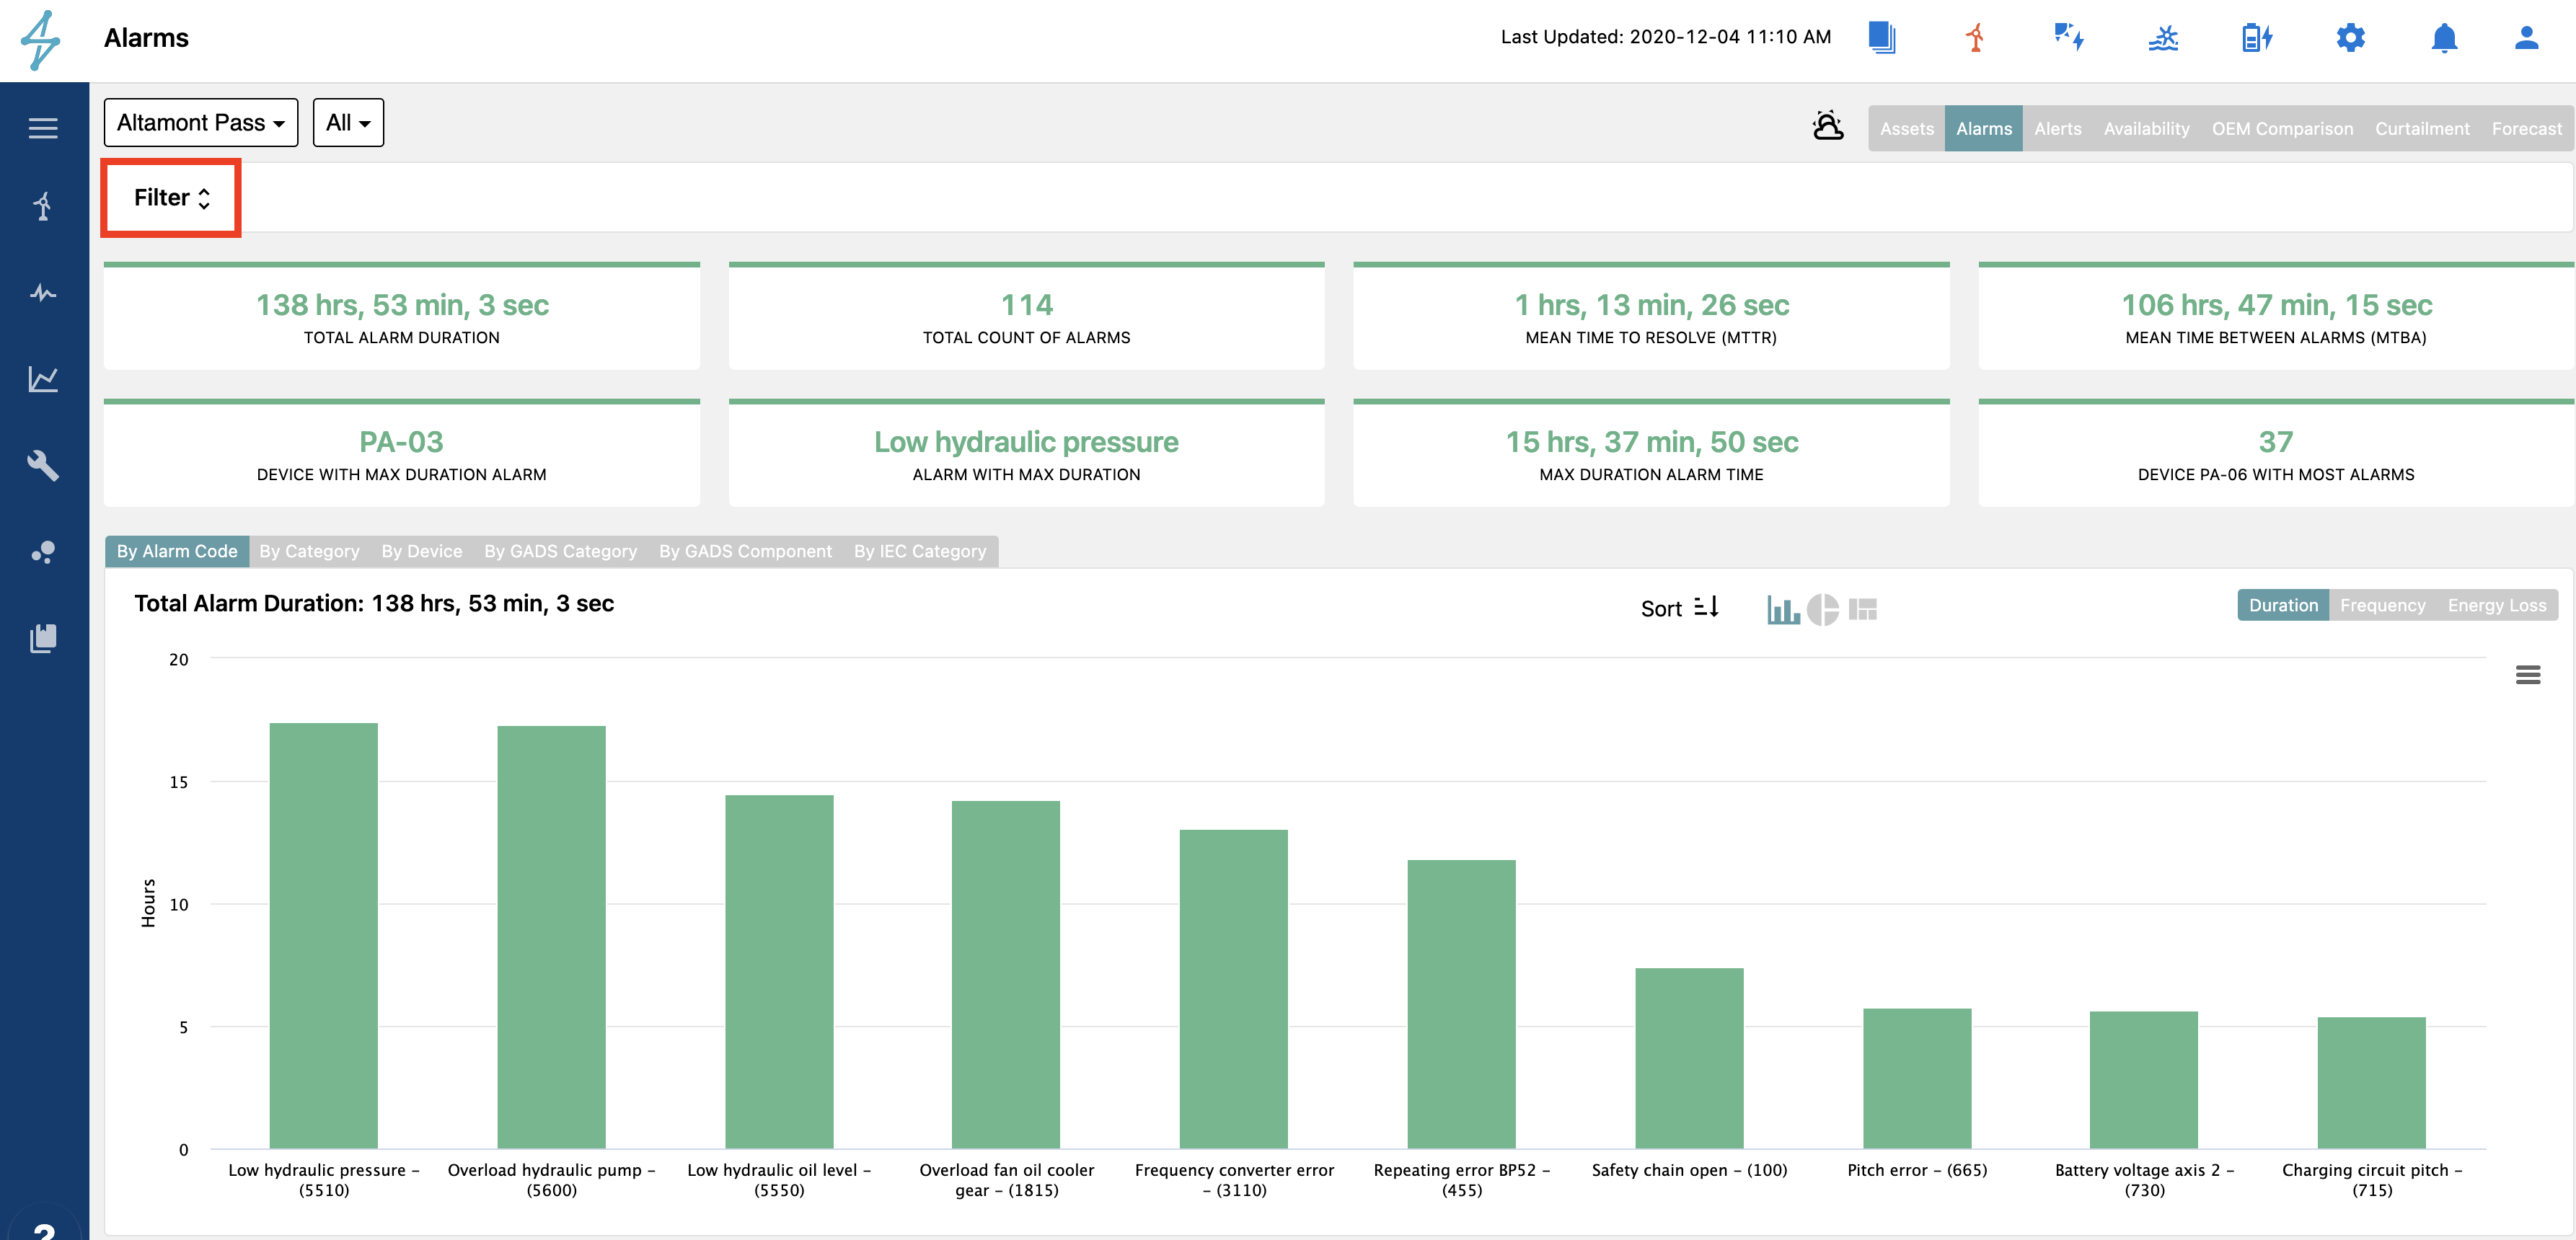
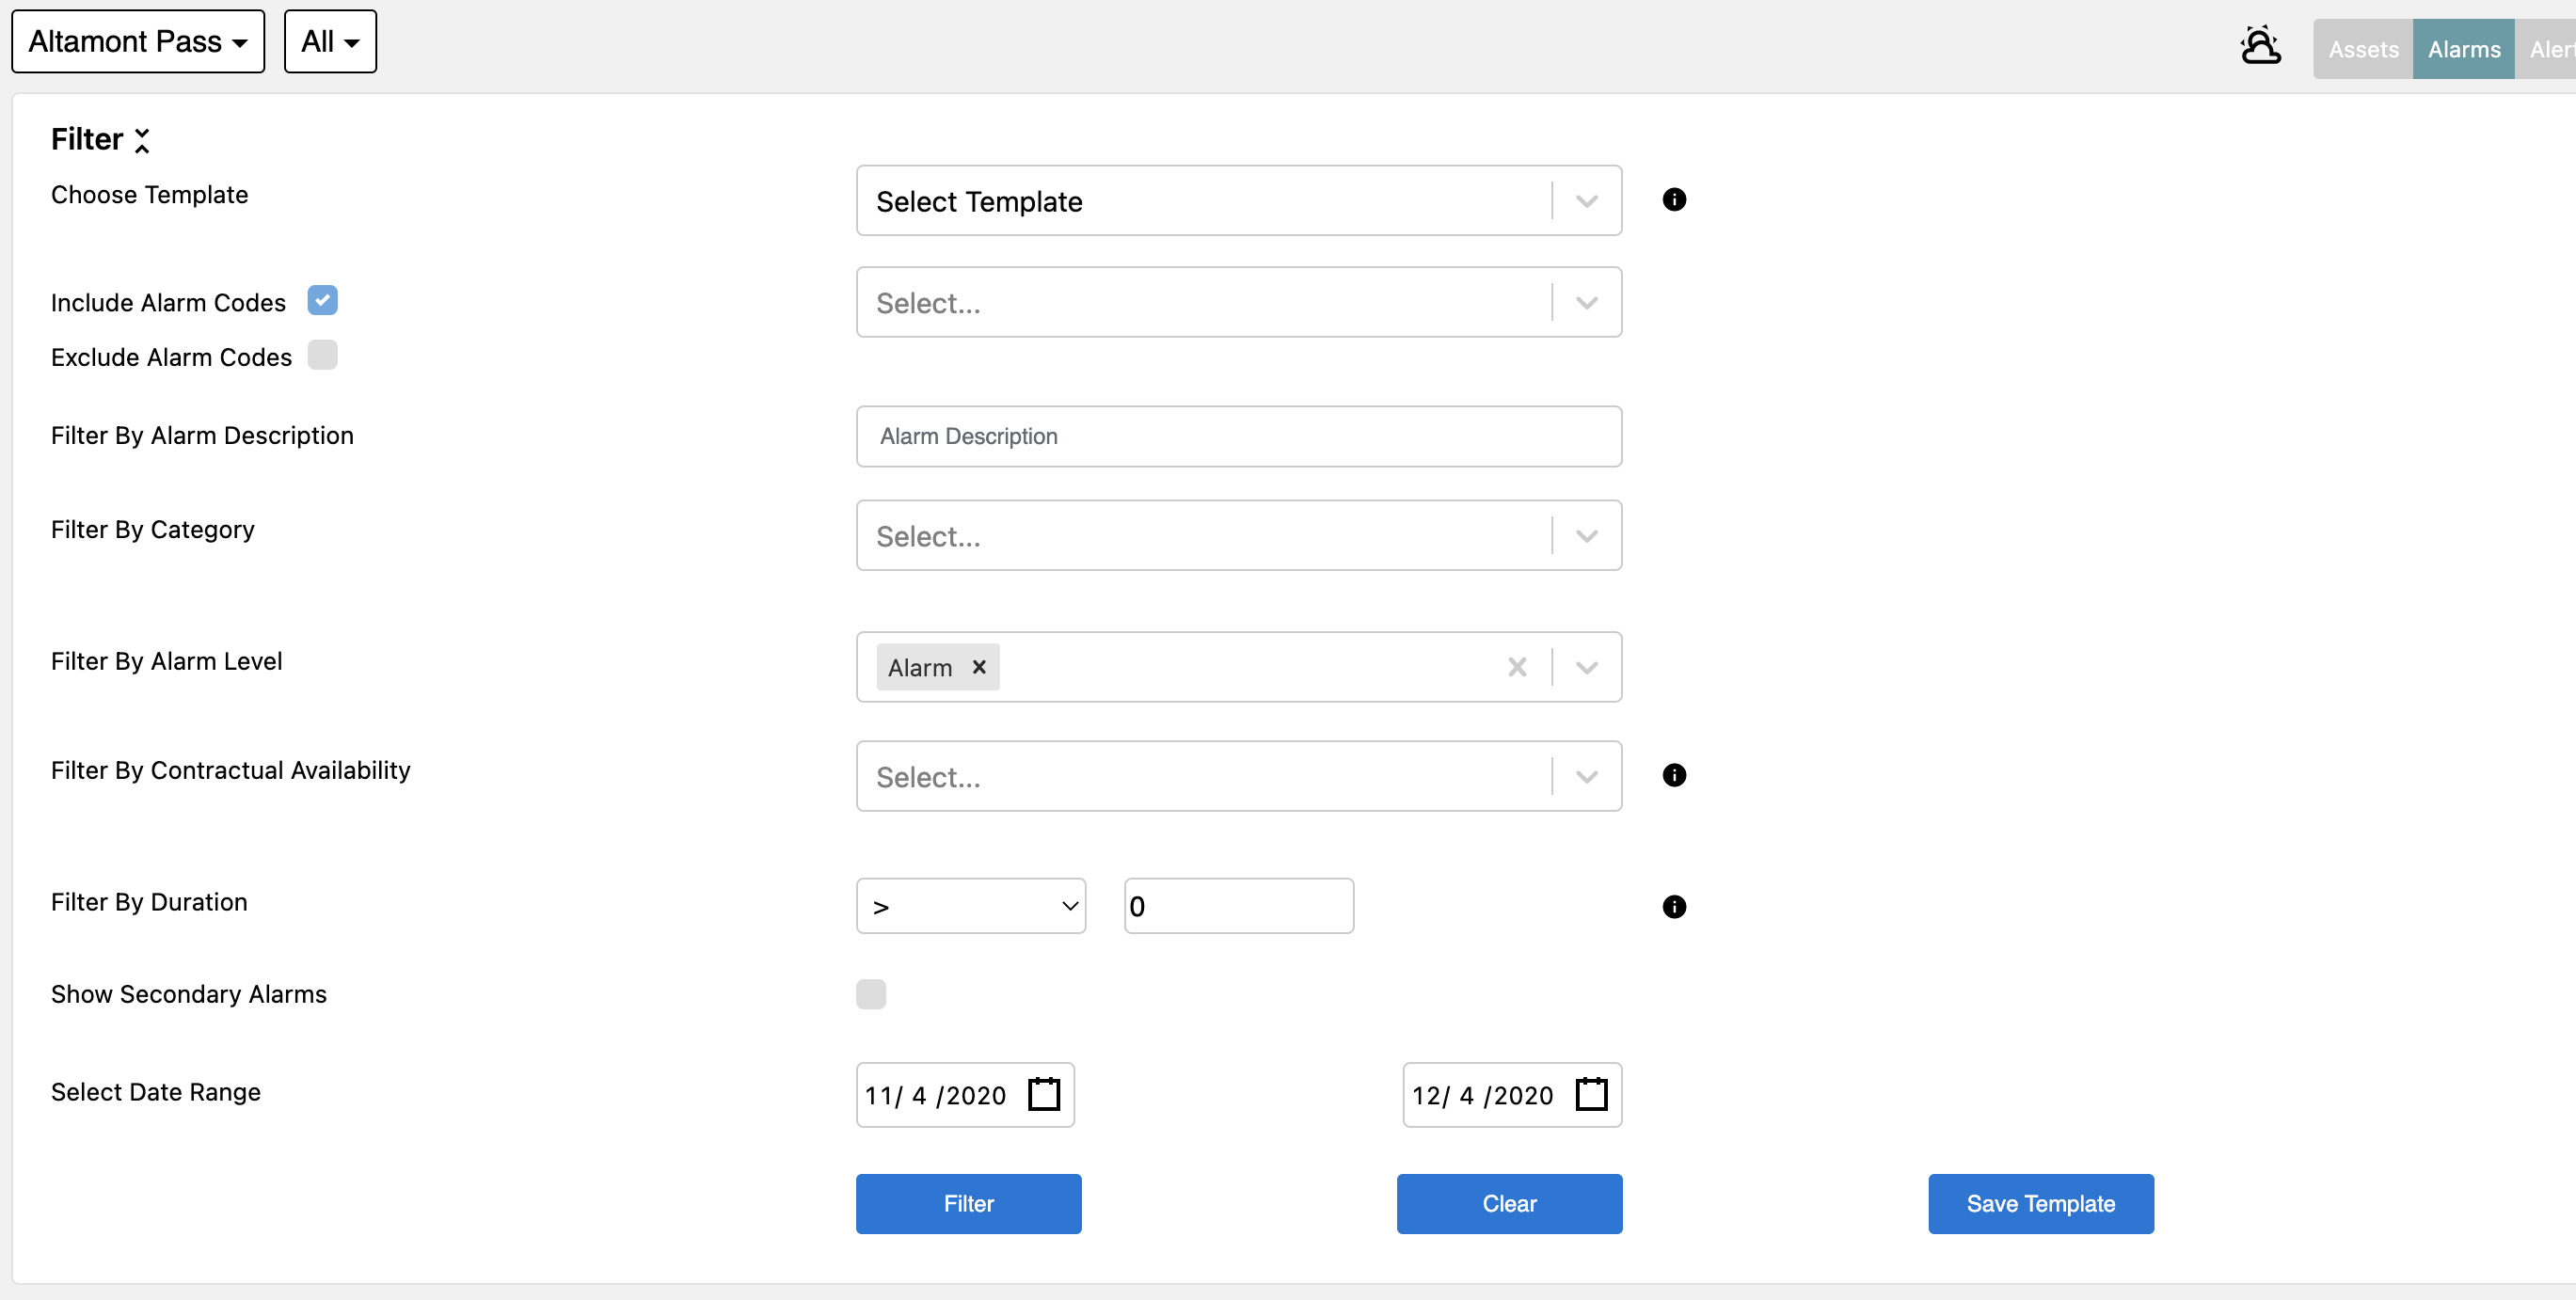
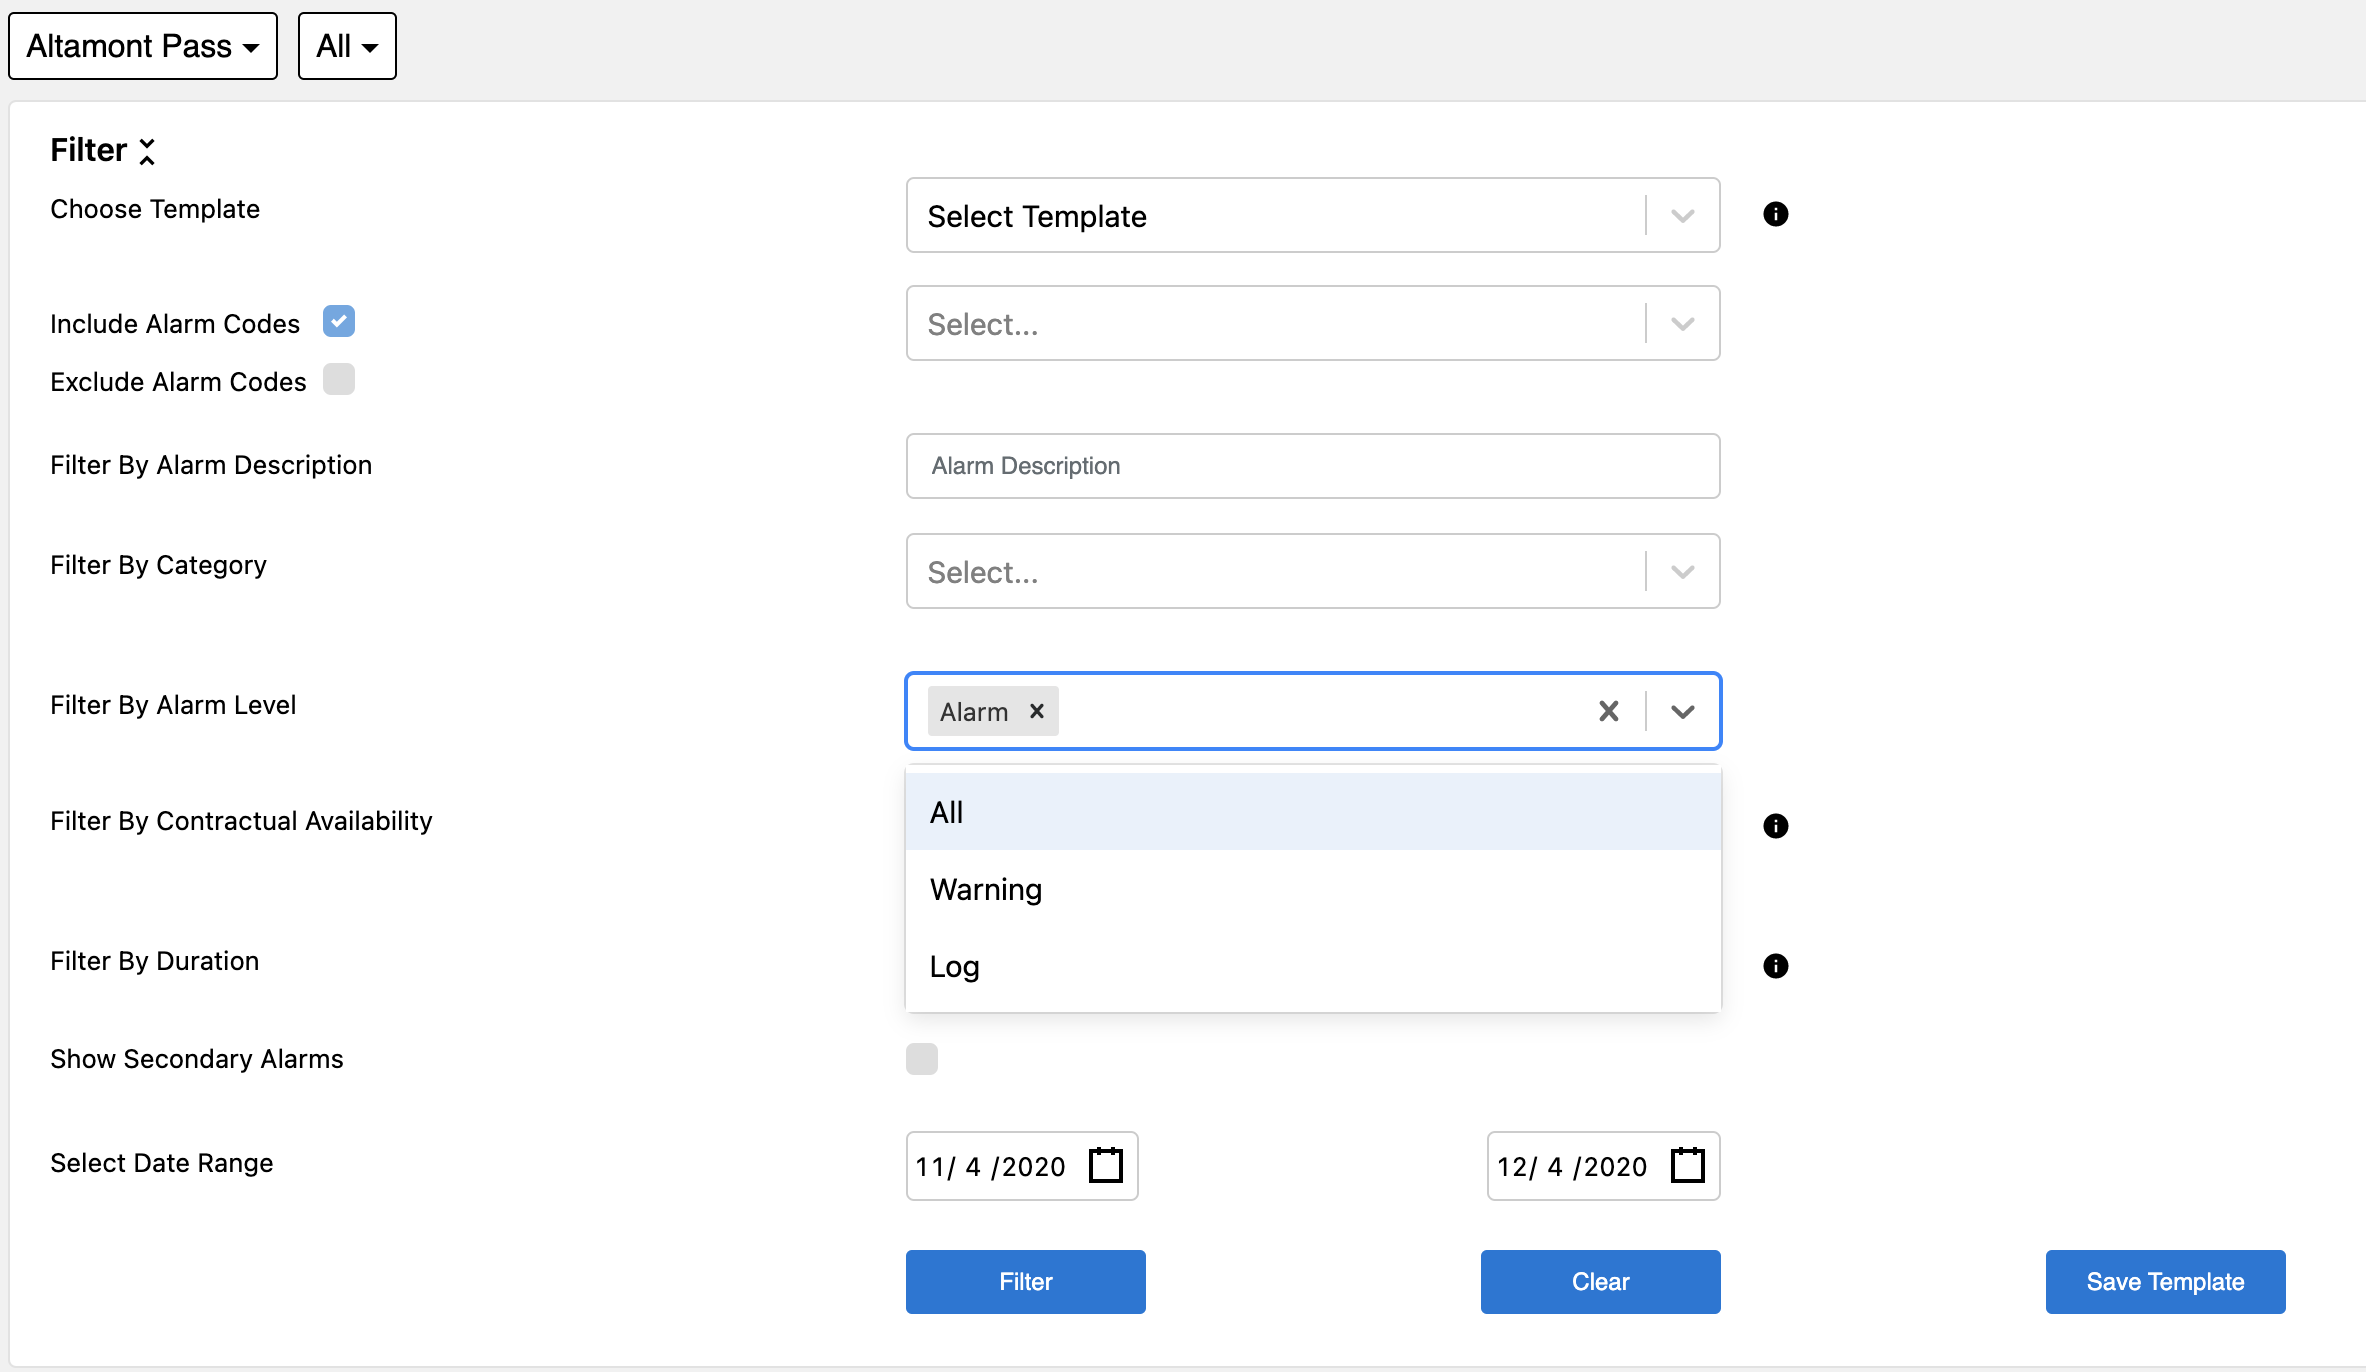
Users can also find additional alarm filters by opening the Filter toolbar from the top of the view. This allows for more in depth searches.
-
Alarm Code
-
Alarm Description
-
Category
-
Alarm Level
-
Contractual Availability
-
Duration
-
Date Range
Alarm Code
Alarm Description
Category
Alarm Level
Contractual Availability
Duration
Date Range
🚧Alarm Start and Resolution Time
Alarm start and resolution times come from OEM alarm signals. These times reflect when the alarm starts and clears and may or may not be the same time the device begins to produce power >0 kW.
Gantt Chart View
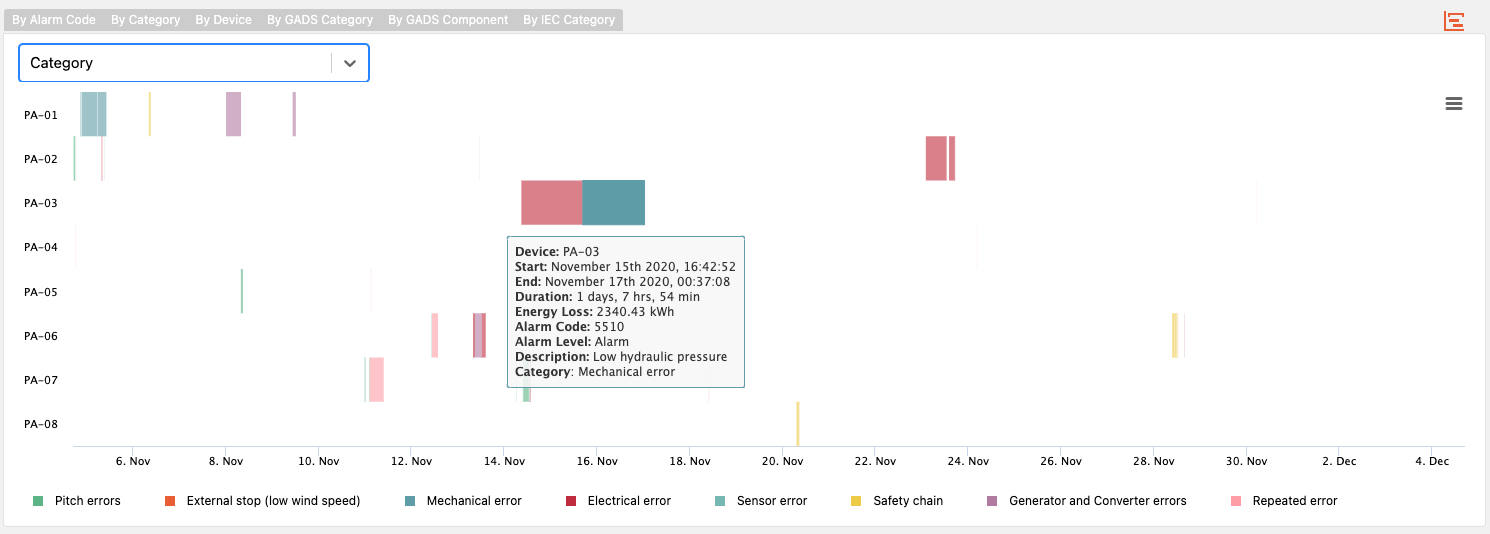
Another helpful view for visualizing alarms is the Gantt Chart View. This is accessed from the corner of the chart from the Alarms tab plot as shown below.

This brings up the Gantt Chart view. Here users can see alarms by device for the filtered time period. In the image below the alarms are color-coded by category, which can be helpful for visualizing how different alarms break down by category code.
Using the drop-down menu, users can also select other options for the Gantt chart visualization.
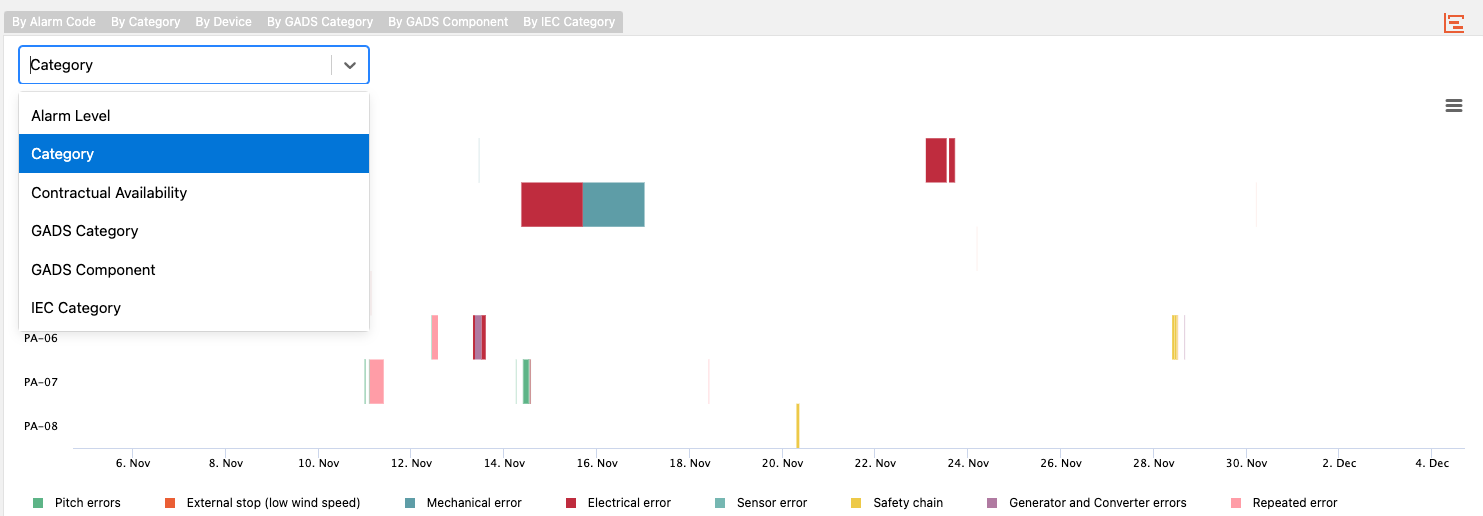
The categories are
-
Alarm Level: This categorizes by Alarm, Warning, or Fault. These should be enabled in the alarm filtering criteria if looking to visualize this way
-
Category: This categorizes the alarms by alarm code category.
-
Contractual Availability: This shows whether the alarm is unavailable or available for that specific device and time period
-
GADS Category: This plots the events by the specific GADS Category if assigned to the alarm code mapping in the admin menu
-
GADS Component: This plots the events by the specific GADS Component if assigned to the alarm code mapping in the admin menu
-
IEC Category: This plots the events by the specific IEC Category if assigned to the alarm code mapping in the admin menu
Alarm Level: This categorizes by Alarm, Warning, or Fault. These should be enabled in the alarm filtering criteria if looking to visualize this way
Category: This categorizes the alarms by alarm code category.
Contractual Availability: This shows whether the alarm is unavailable or available for that specific device and time period
GADS Category: This plots the events by the specific GADS Category if assigned to the alarm code mapping in the admin menu
GADS Component: This plots the events by the specific GADS Component if assigned to the alarm code mapping in the admin menu
IEC Category: This plots the events by the specific IEC Category if assigned to the alarm code mapping in the admin menu
Plotting Alarms
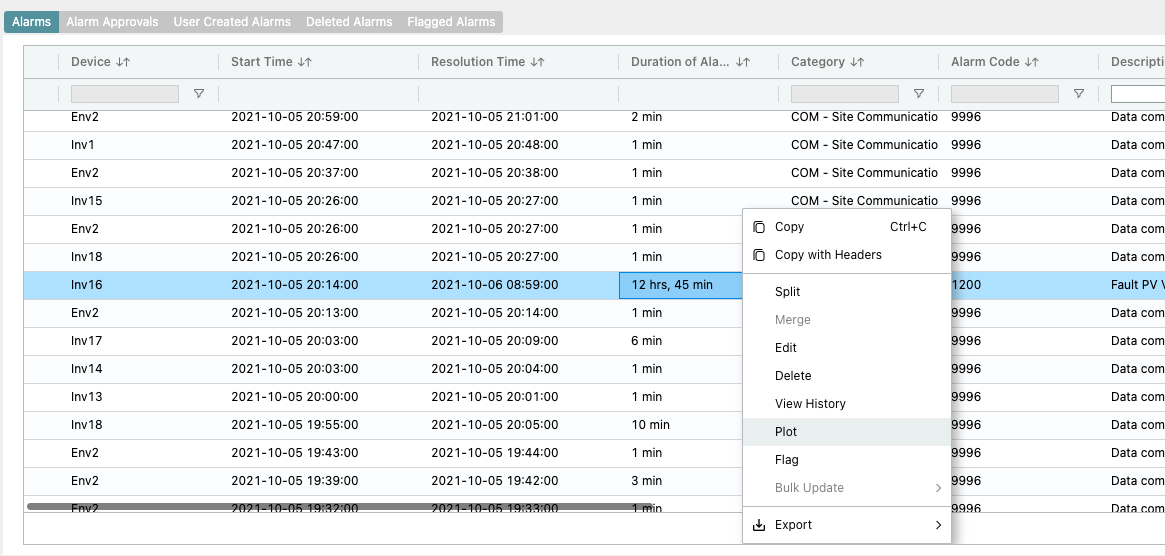
Another helpful feature of the Alarms Module, is the ability to plot variables associated with specific alarms. To do this, right click on the desired alarm and select Plot from the menu.
This brings up a window with a time series plot showing the effect on production of this alarm in this instance.
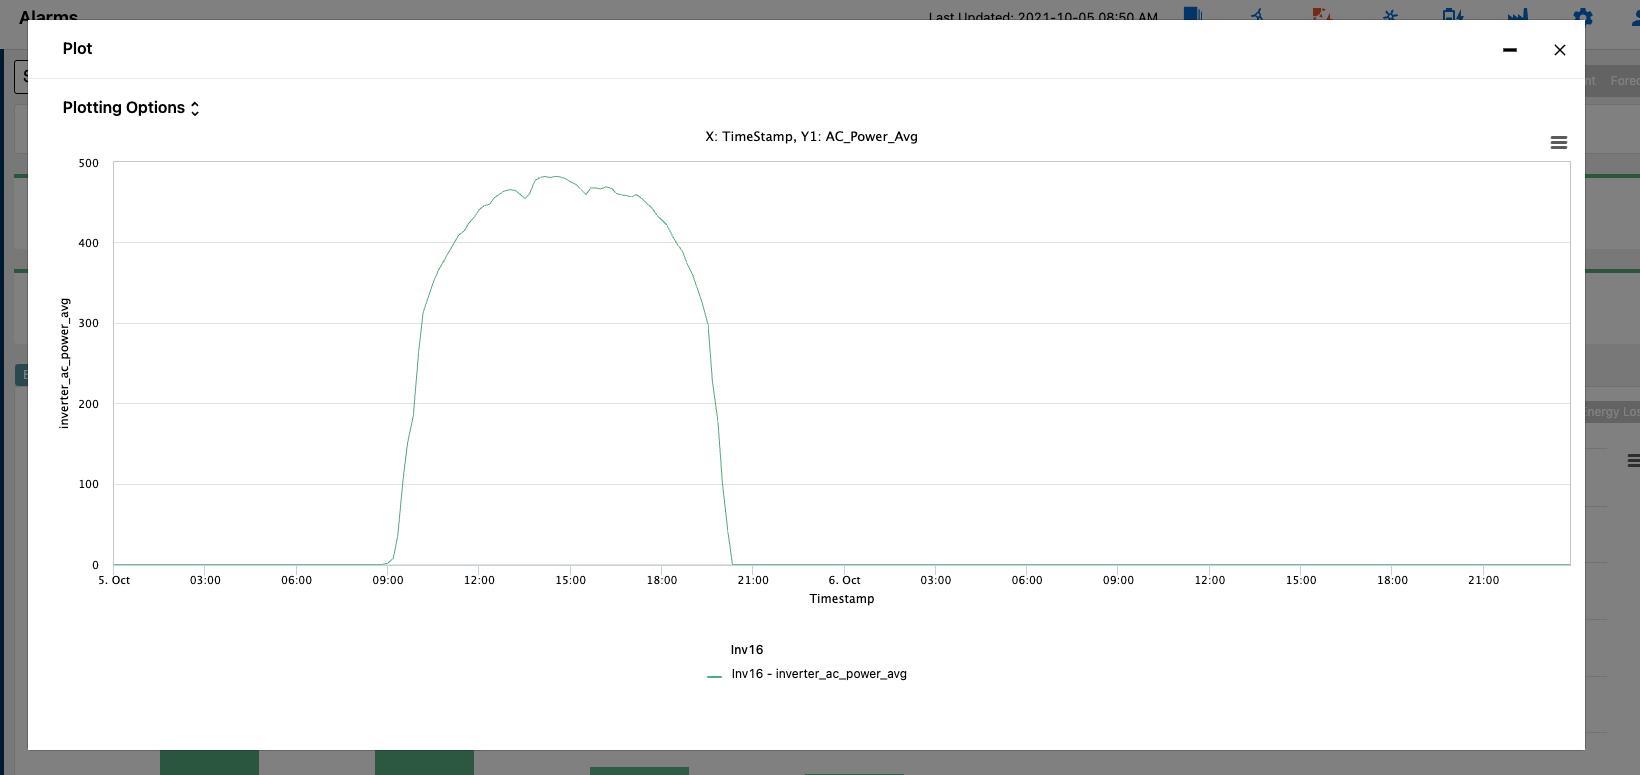
This can be a helpful feature for validation of events to see if they are actually effecting production or are a viable alarm.
Editing Alarms/Events
The SparkCognition Renewables Suite platform automates downtime tracking and classification of downtime events. If the availability module is subscribed, contractual and technical time-based and energy-based availability are also calculated automatically. However, some events are ambiguous such as a Manual Stop, which may be classified as Available or Unavailable depending on the details of the event. The initial classification by the platform is based on mapping defined in Alarm Codes during onboarding. However, users can edit individual events under Alarms or Availability Module.
To edit a particular event, go to the Alarms tab in the Monitor module, and select the desired event, and right-click on the specified alarm to bring up the Edit Alarm window.

Here users can update all categories based on the desired changes they need to make. Once the change is made, user name will be stored in the Updated By and Updated At columns. Once the event is approved, the change will trigger a re-calculation of the availability statistics.
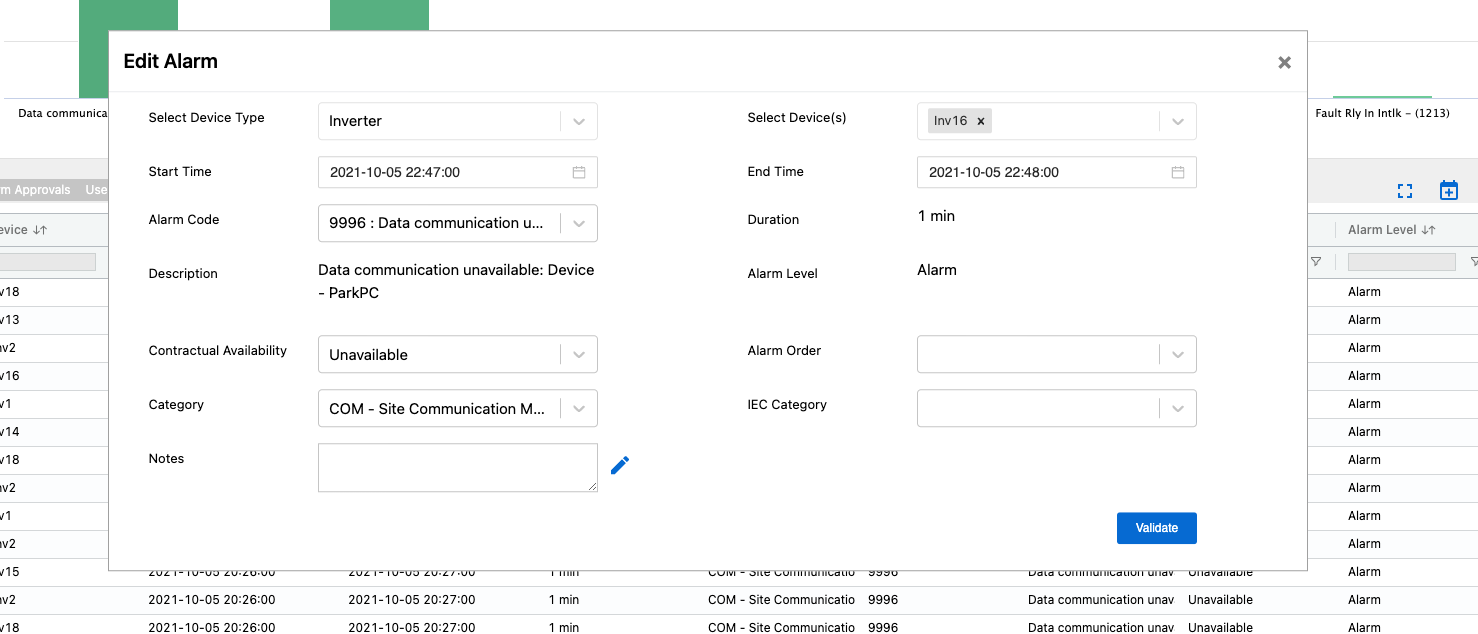
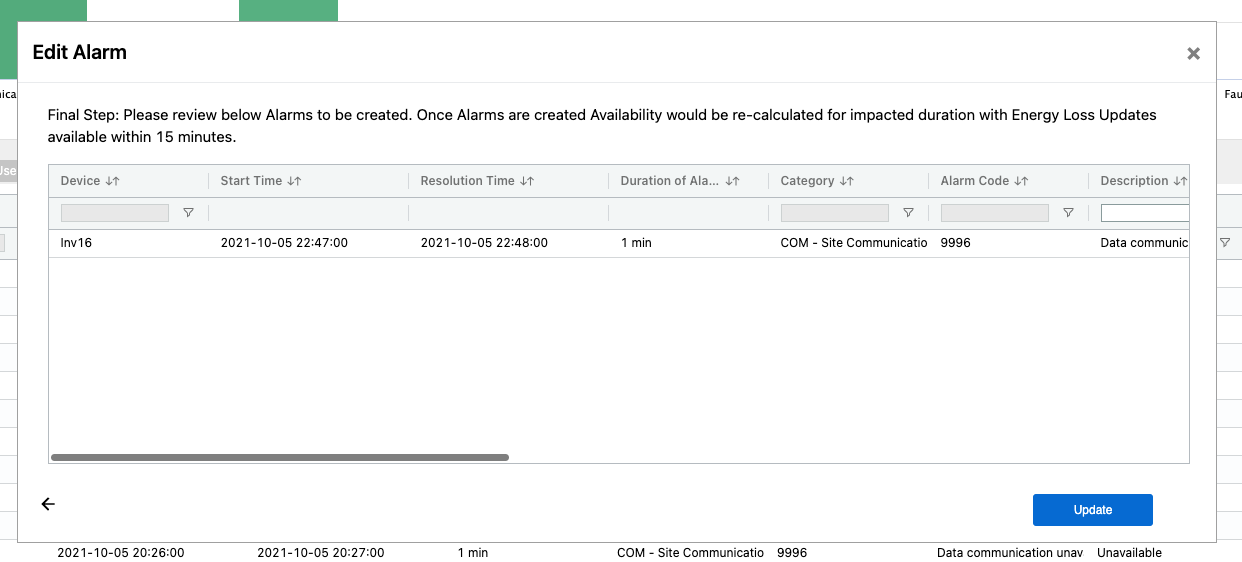
Once the changes have been made, select Validate to confirm the change. This will take the user through a few confirmation windows where a couple checks are made based off of existing alarms looking for mixed device types and overlapping alarms. If everything looks good, the user can update the alarm on the final screen and wait for the changes to take place.

If the alarm changes affect the availability calculation, they may require approval. If they require approval they will show as Pending under the Approval Status column. Pending alarms can also be found under the Alarm Approvals tab.

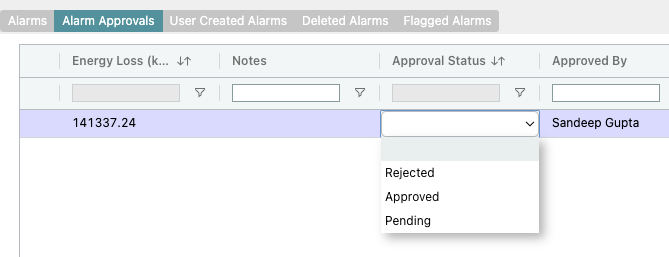
Here, users with Availability Approver permissions can approve any alarms that have been edited effecting availability.
Bulk Updates
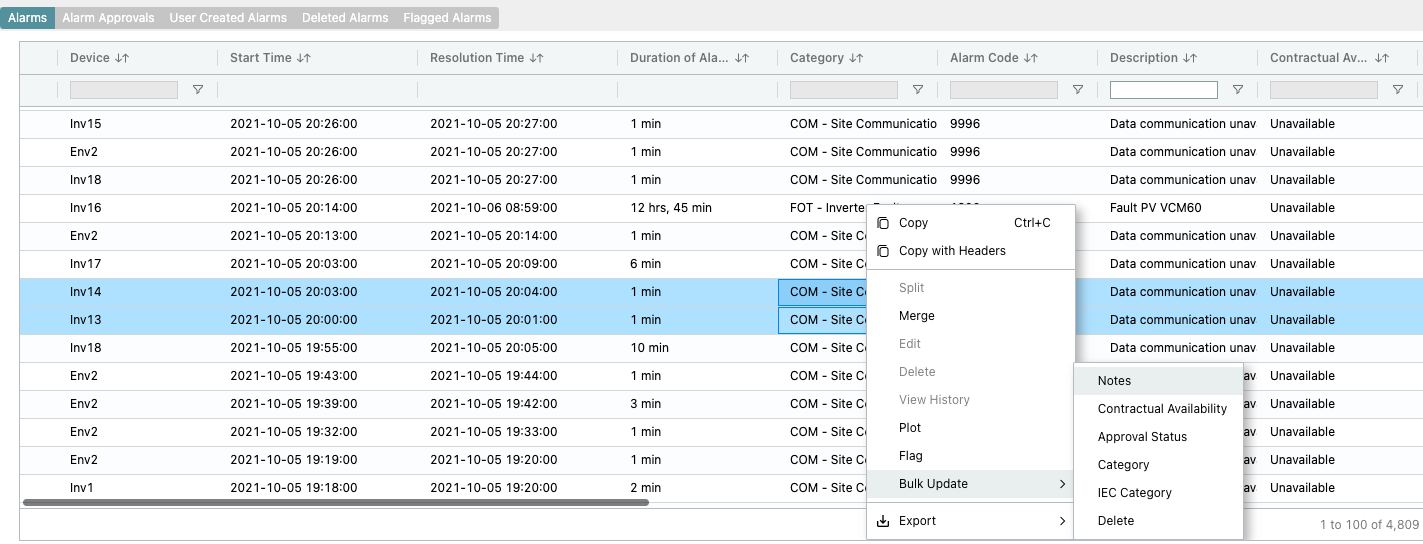
In addition to selecting and editing of a single event users can select multiple events by using Command or Ctrl + Click on the events and doing a right click on selected events. With the list of events selected users can bulk update Notes, Category, and Contractual Availability of all events at once. This allows for users to update more than one event e.g. adding bulk notes on list of selected events all at once.
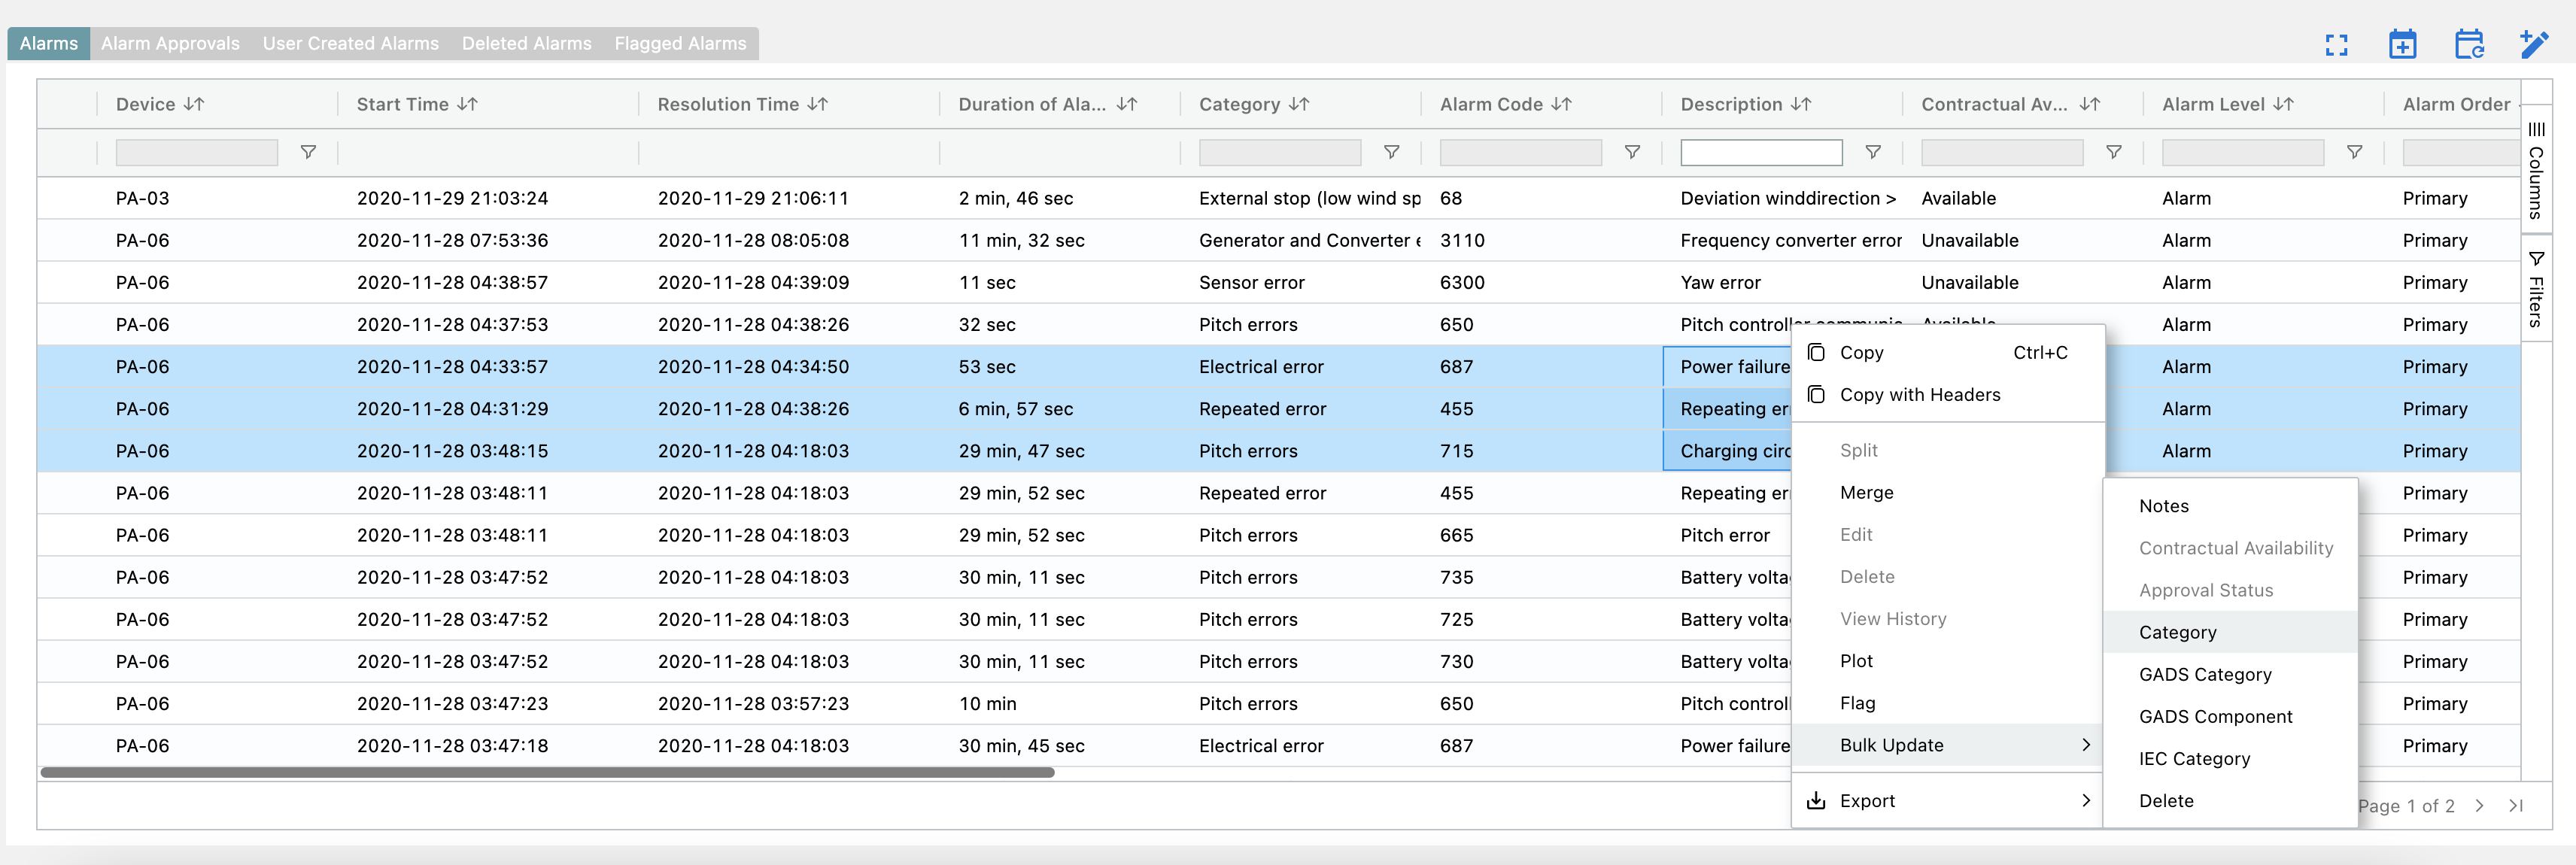
Alarms - Bulk Updates
Selecting the Bulk Update criteria brings up a more simplified menu than that of single alarm editing. It only allows for modifying a single field type at once. In this instance it is Update Category.
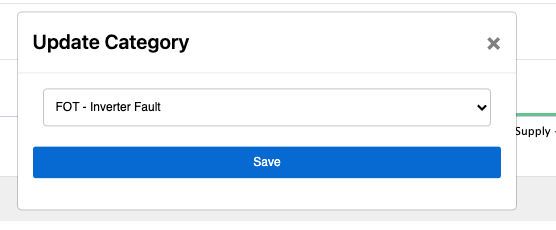
🚧Bulk Update Device Types
Bulk updates are only allowed for assets with the same device type. Wind being the same turbine type, and solar the same inverter.
View Alarm History
To track any changes made to an Alarm and view its change history, users can simply right click on any updated alarm and click the View History button. If the event has not been modified then the view history button is greyed out. If there have been updates made by users on an event then the previous state of the alarm with details about the Action are shown in the View History popup.
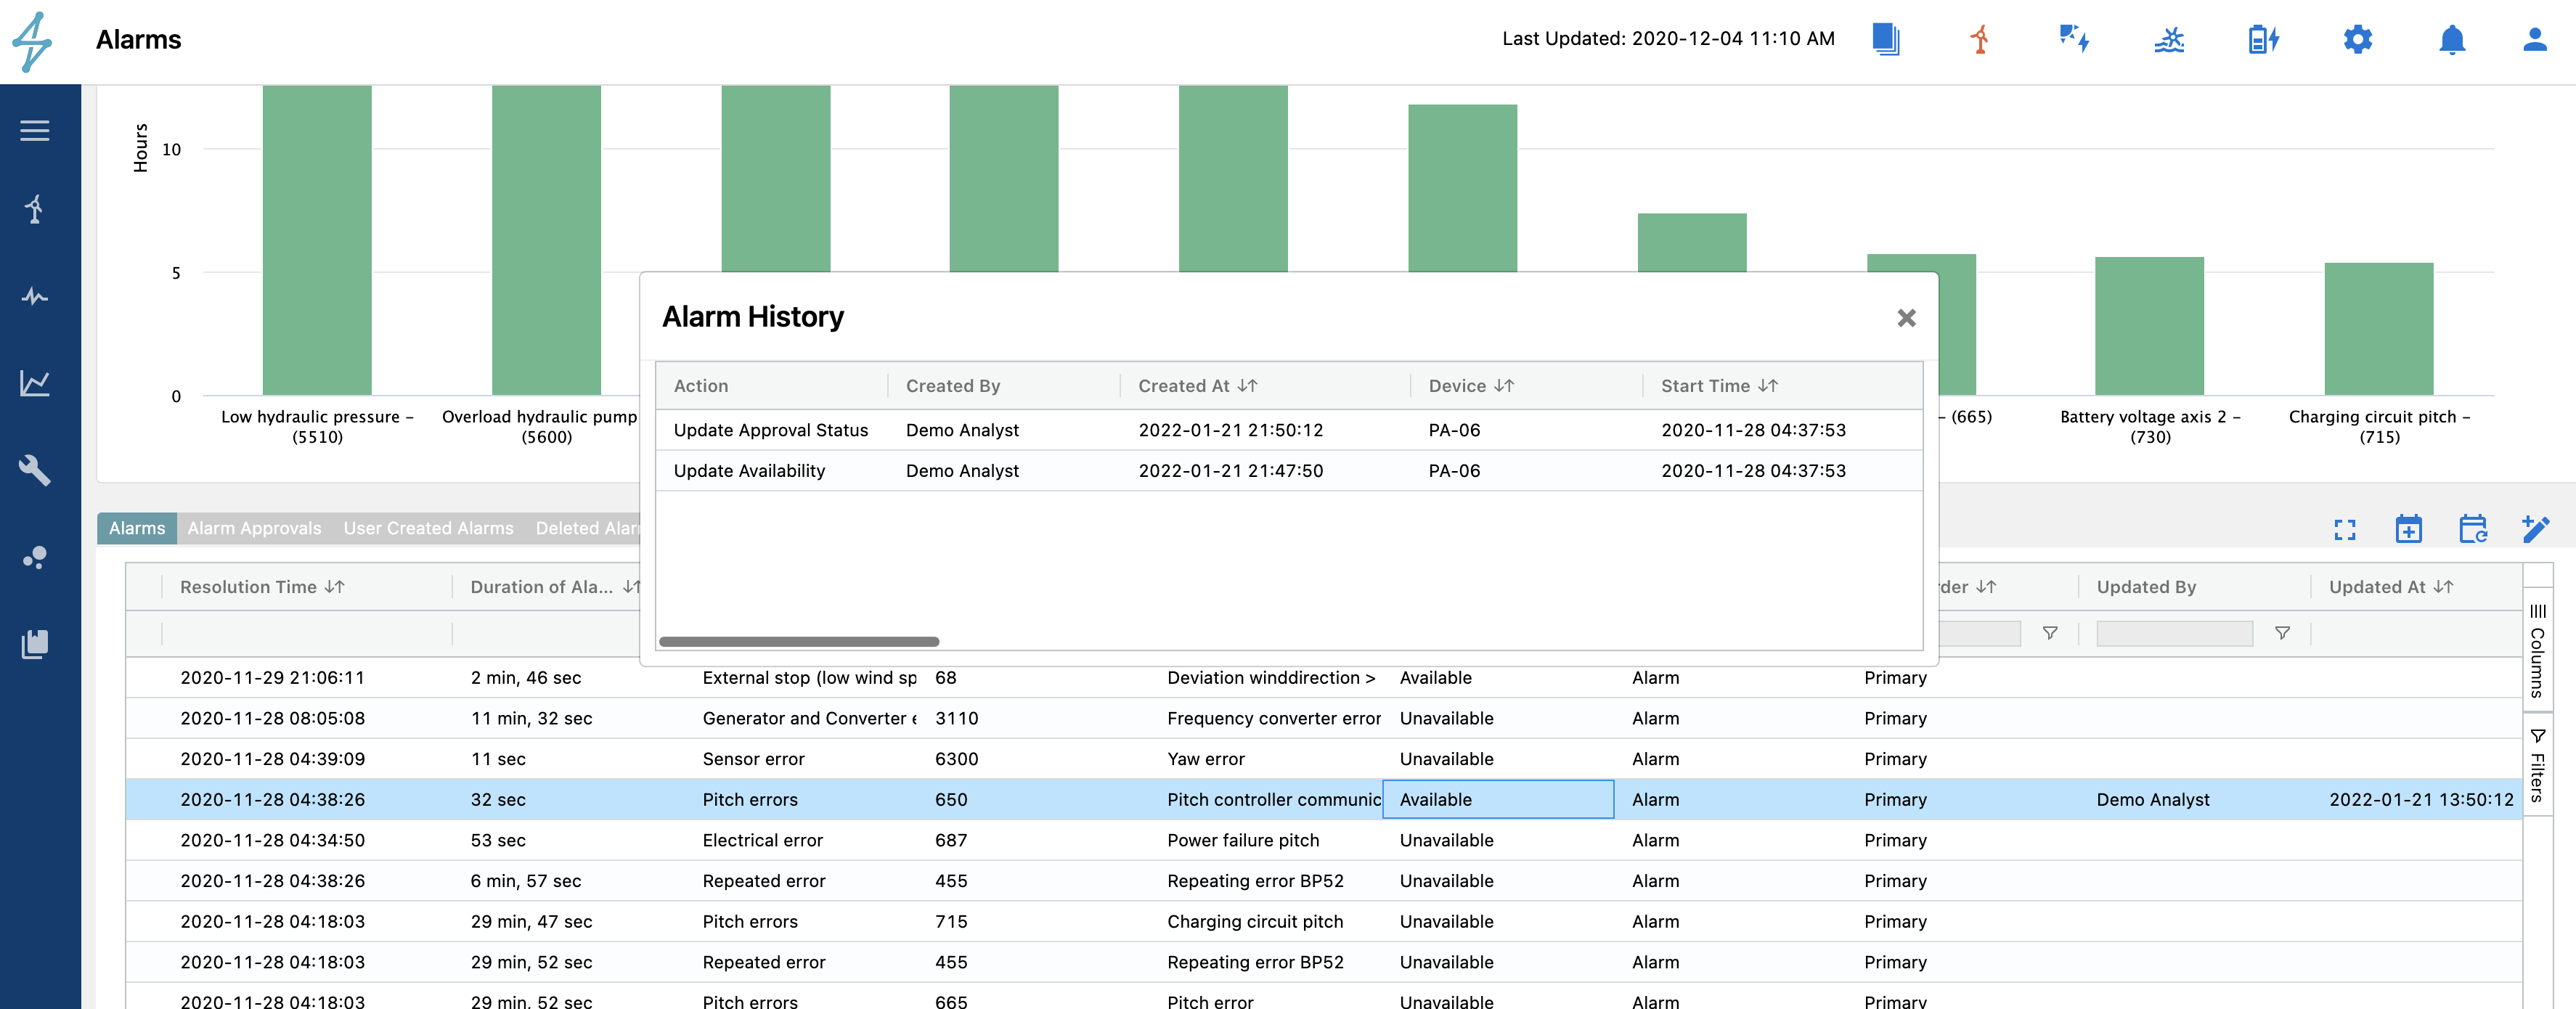
Alarms - View History
Split and Merge Events
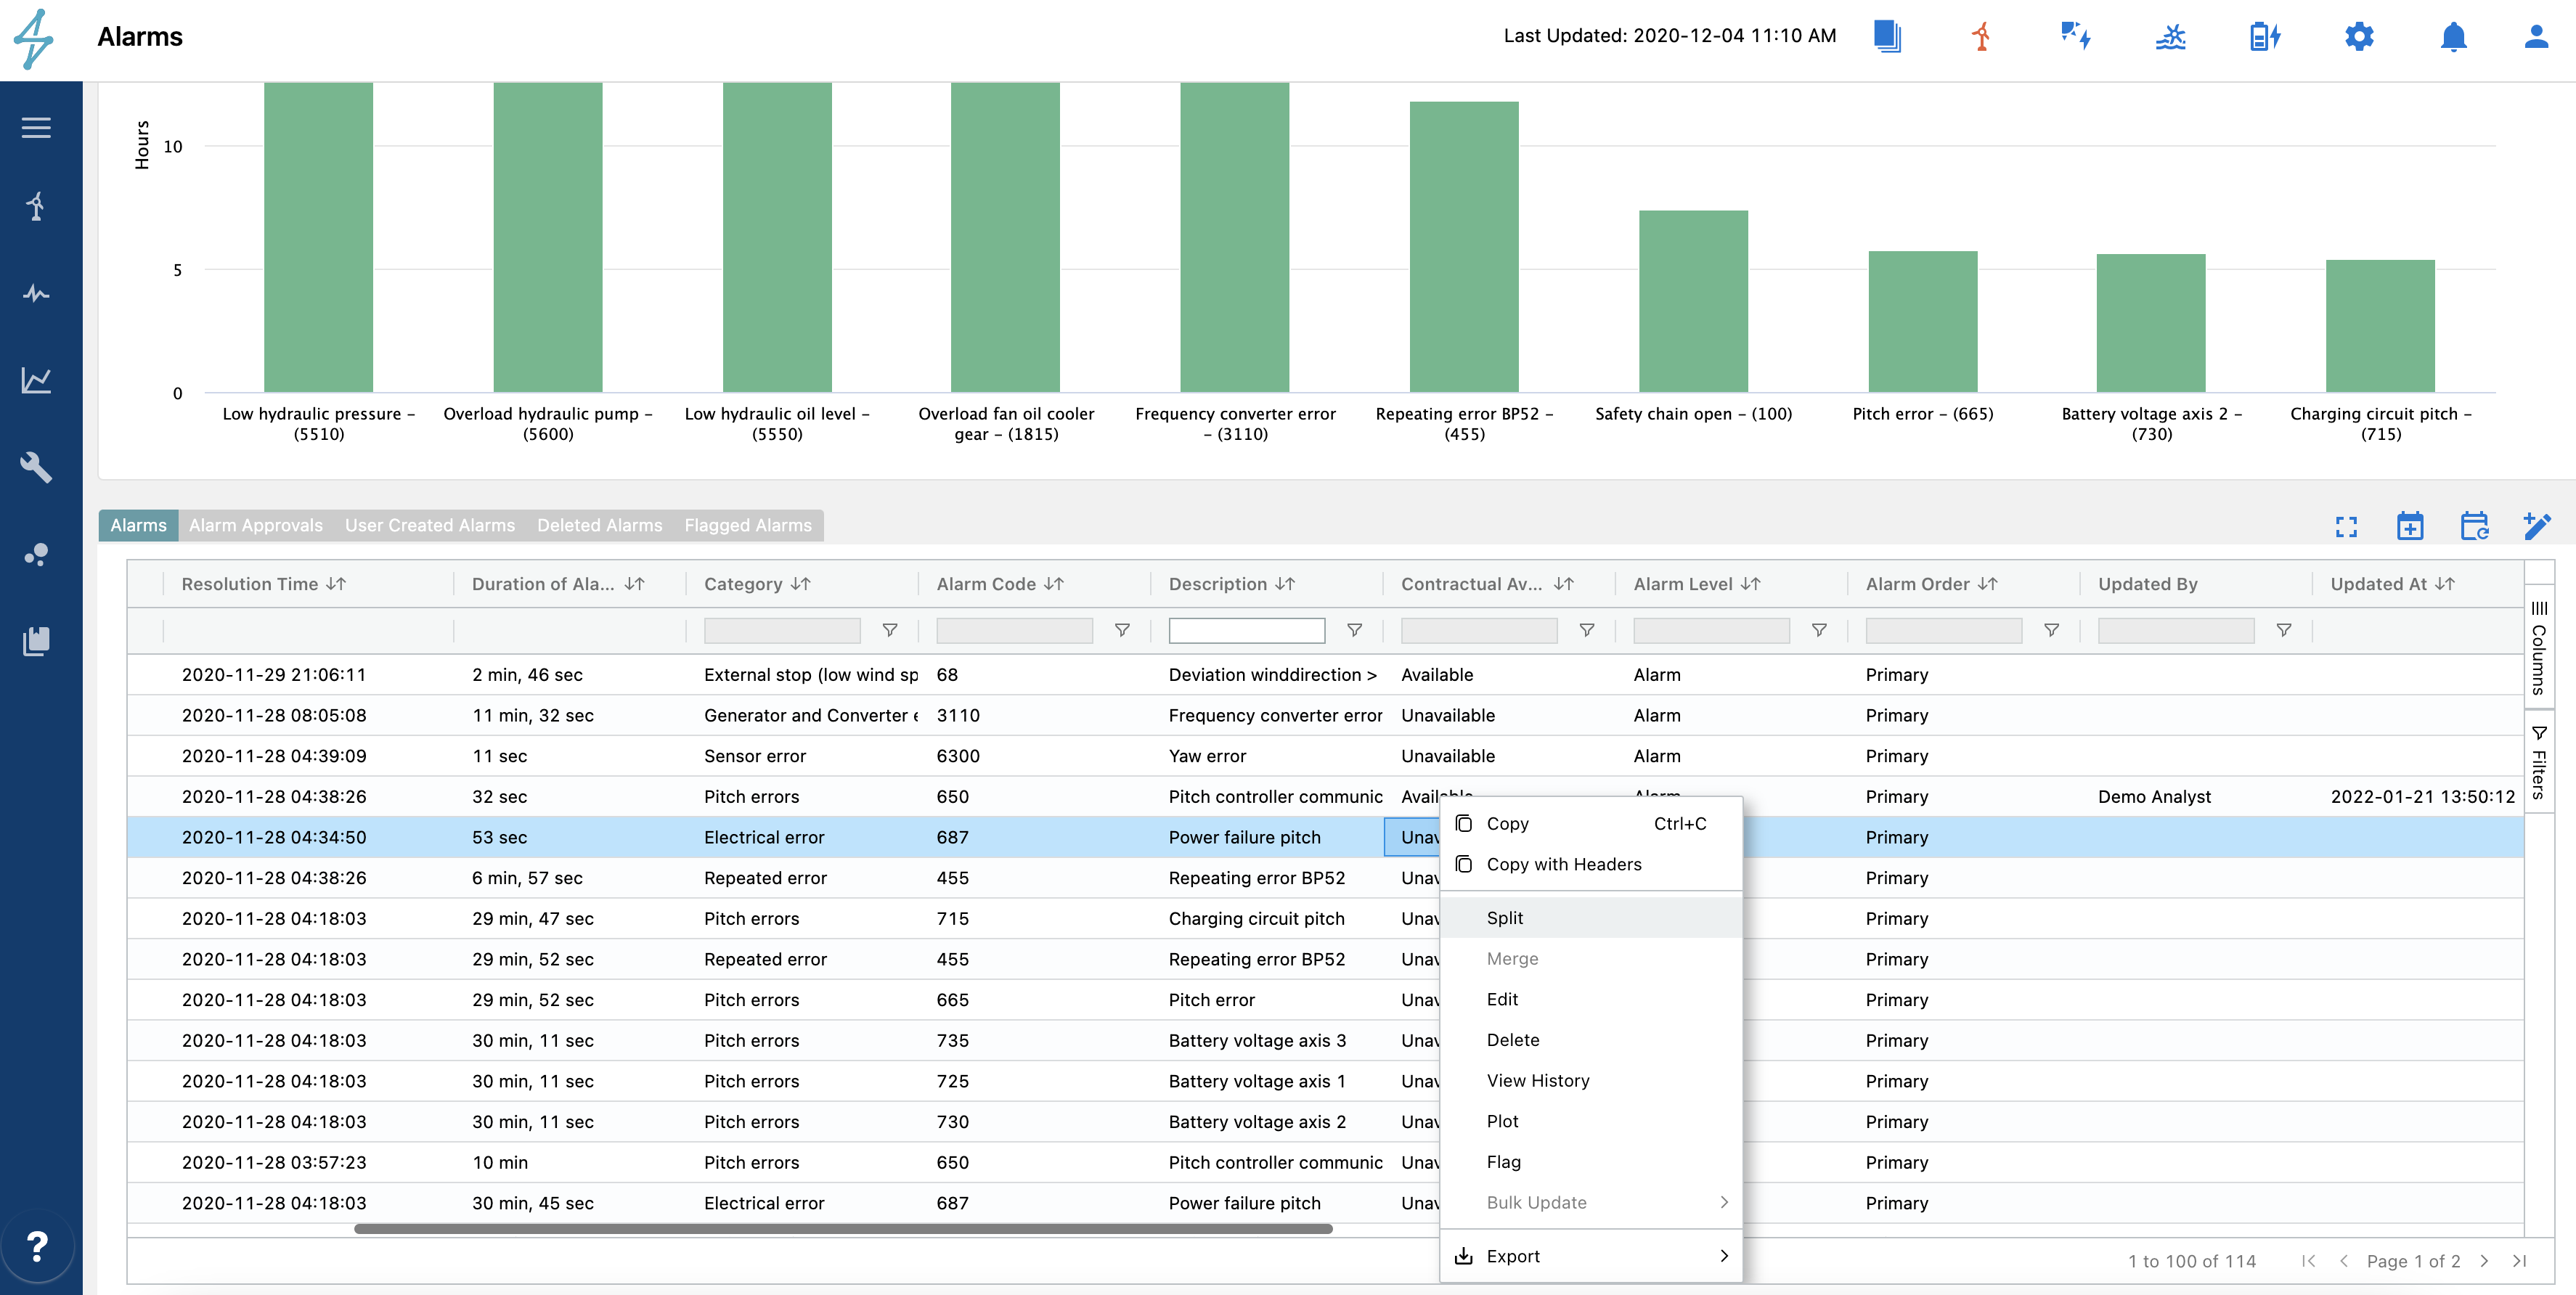
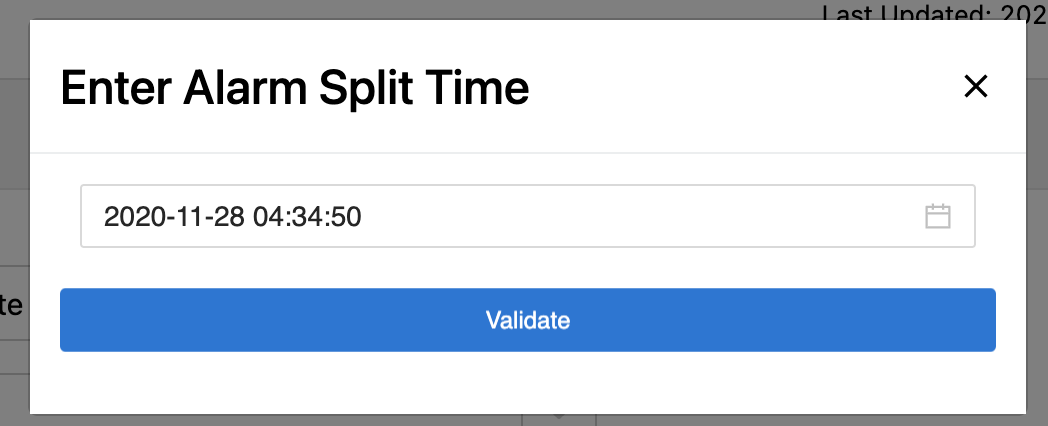
There are some situations where the downtime event needs to be split into two or more events. This can be performed in the platform in either the Alarms tab or the Availability tab. In the Alarm tab, start by selecting the desired event, then right click on the event and you will see an option to split the event. Once you click on “Split”, the user will see a pop-up asking for Alarm split time. In the example below, if the user wants to split the 41 min duration into two events one for 15 minutes and another one for 26 minutes, the user will enter split time of “2020-12-04 21:40:00” and the event will be split into two events. You can also choose to edit the Alarm Code and the Contractual Availability for the split event. Additional notes can be added in the Notes section for explanation of why the event was split into two or more events.
Split Time
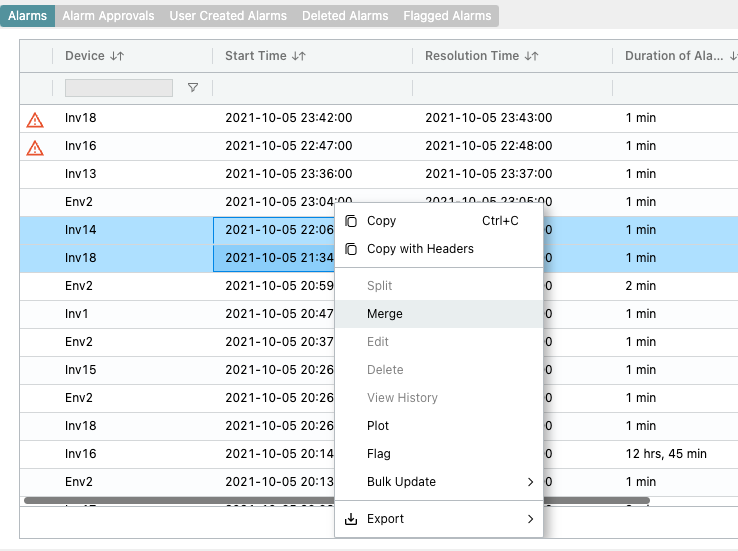
On the other side, there are times where it may be convenient to merge two alarms together. This can be done by selecting the alarms to be merged, right clicking, then selecting Merge.
🚧Merging Alarms
Only alarms from the same Device can be merged. For example two alarms from Inverter 1 may be merged but one alarm from Inverter 1 and one alarm from Inverter 2 may not.
Create/Delete Alarms Video Walkthrough
Creating Alarms
Users can create an alarm by selecting the Add Alarm blue "+" sign icon in the top right corner of the alarms table.

Selecting this view brings up the Add Alarm window where users can add an alarm and select the desired criteria for creating a new alarm. Here, select the device type and device(s), the start and end time of the alarm, the alarm code, availability, alarm categories, and any notes for reference. Once you have selected the alarm details, click Validate.
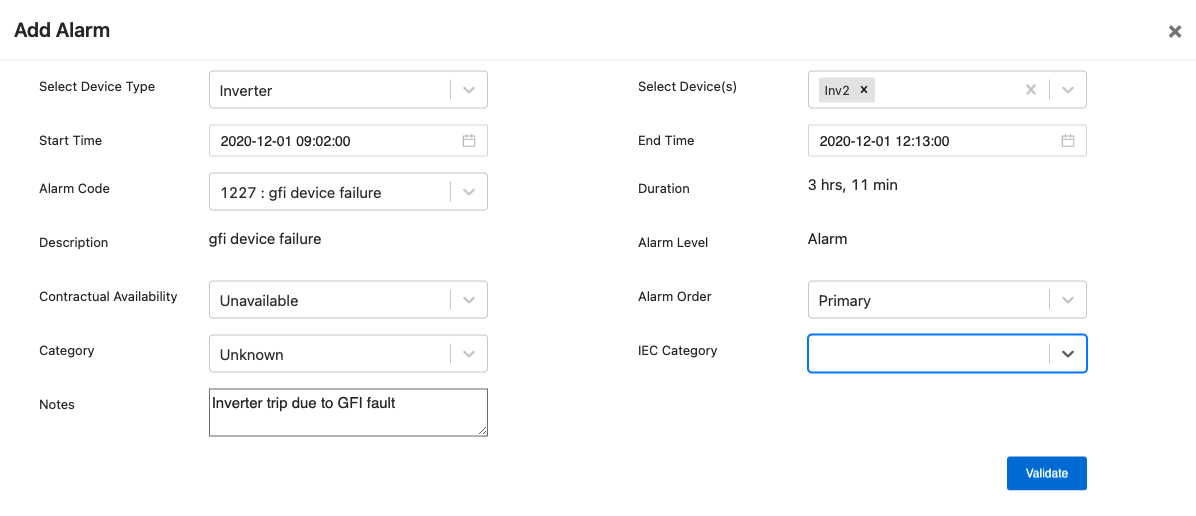
If any issues were found users will get a message letting them know. If issues were found, read and address the message before proceeding. If no issues were found, click Continue. Review the details of the alarm that will be created and, if all looks good, then click Create. The newly created alarm will appear under the tab User Created Alarms.

Deleting Alarms
There may also be situations when a user needs to delete an alarm. This can be performed on the platform in the Alarms tab in the Alarms table. In the Alarms table, find the alarm that needs to be deleted, right click the entry for a pop up menu, then select Delete from that pop up menu.

Predefined Notes
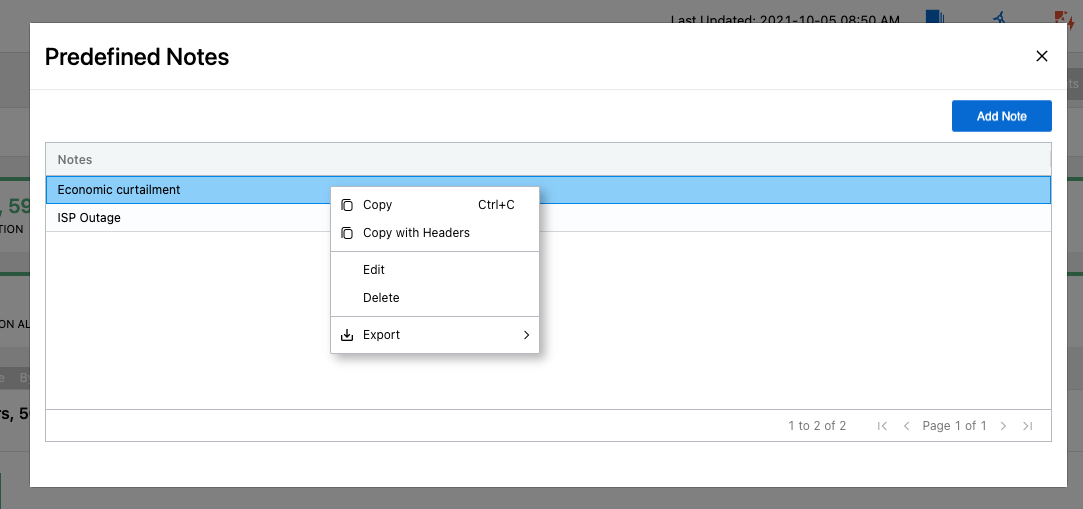
Predefined notes is a feature that allows users to store commonly used notes as a predefined note in the platform. This is accessed by selecting the Predefined Notes(or pencil) icon in the top right corner of the alarms table.

This brings up the Predefined Notes menu where users can add notes and edit and delete existing notes.
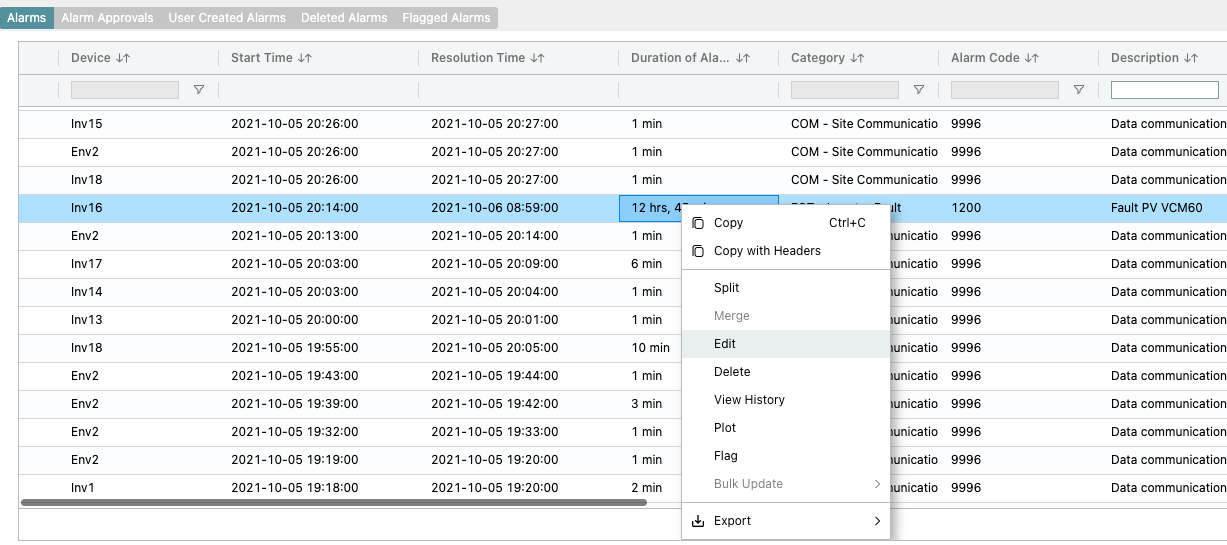
Once a note is added it can be added to a single alarm by right clicking on the specific alarm and selecting the edit option to bring up the edit alarms menu.
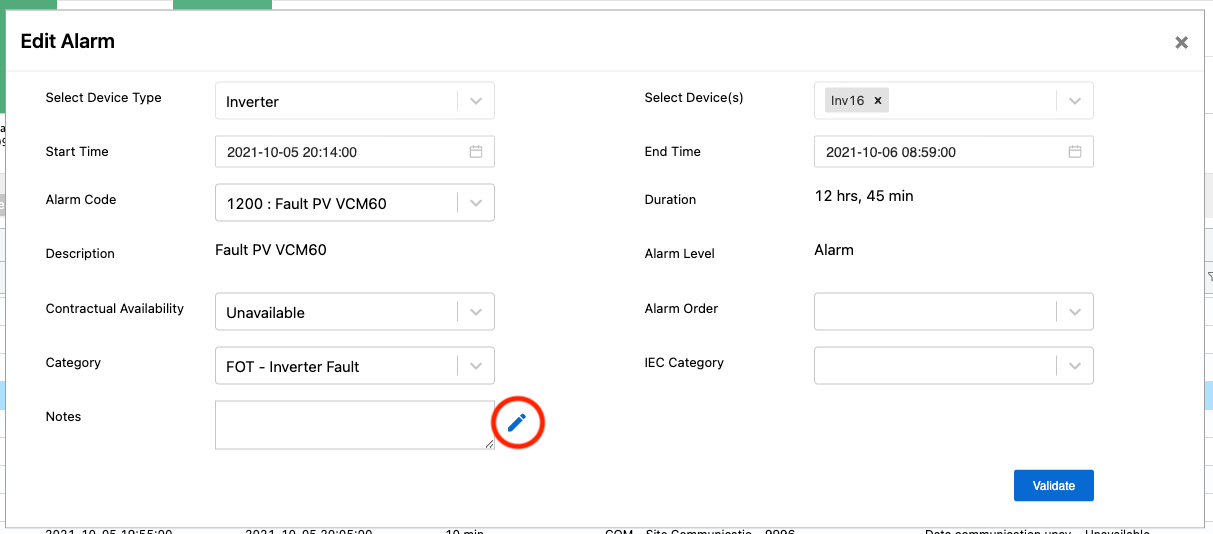
From the Edit Alarm menu the Predefined Notes can be accessed by selecting the pencil icon next to the Notes box.
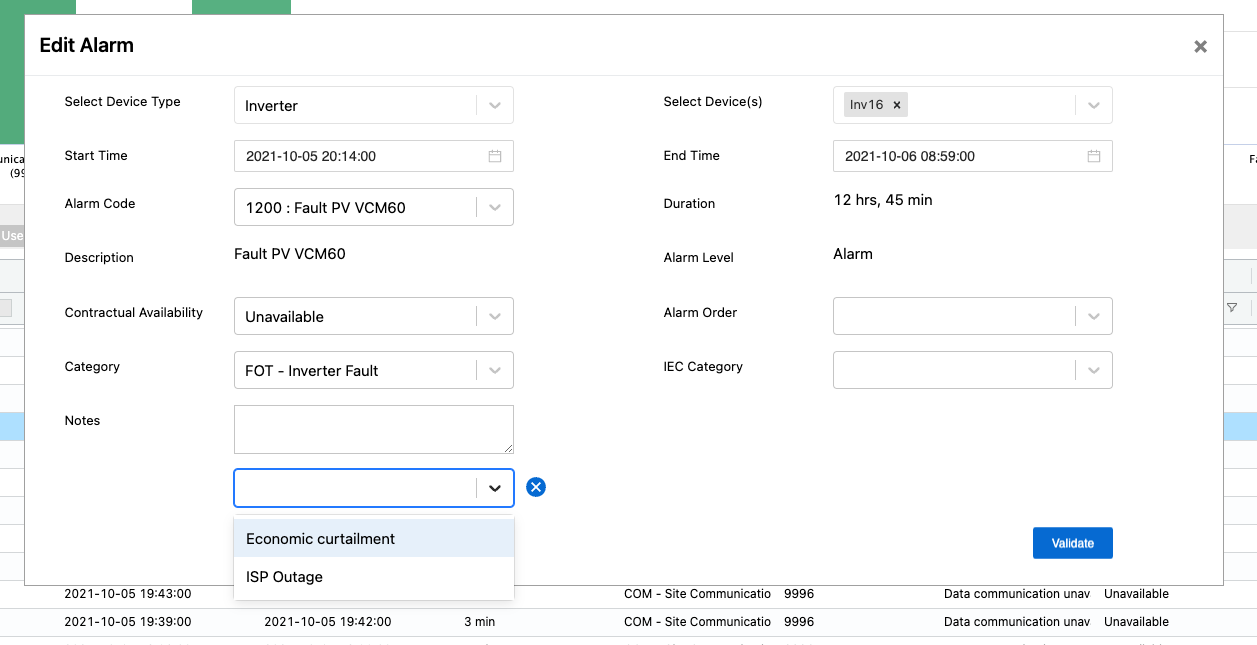
This brings up the Predefined Notes dropdown menu, where user defined Predefined Notes can be accessed.
For Bulk Updating notes, users can follow the Bulk Updating process by selecting multiple alarms and right clicking to bring up the Bulk Editing menu options. From here select Notes to bring up the Notes editing menu.
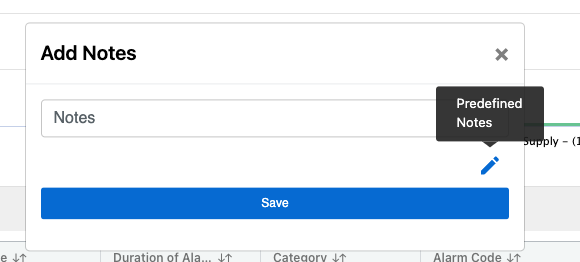
Once the Add Notes menu has been brought up, select the pencil icon in the bottom right corner to bring up the Predefined Notes menu.
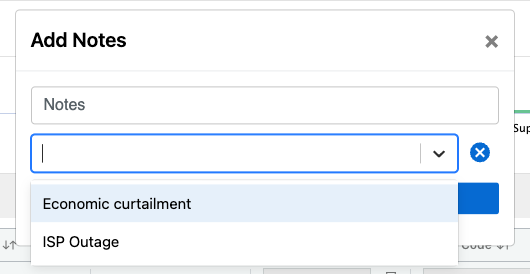
Once the Predefined Notes bar has been brought up, users can use the dropdown to select from stored Predefined Notes.
Alarm Flagging
Users also have the availability for flagging alarms for review. This process creates a helpful workflow for alarm reviewing, creating the ability for users to easily flag alarms for a second set of eyes to take a look at in a review process.
Users can flag alarms by right clicking the desired alarm and selecting Flag. This brings up the Flag Alarm menu.
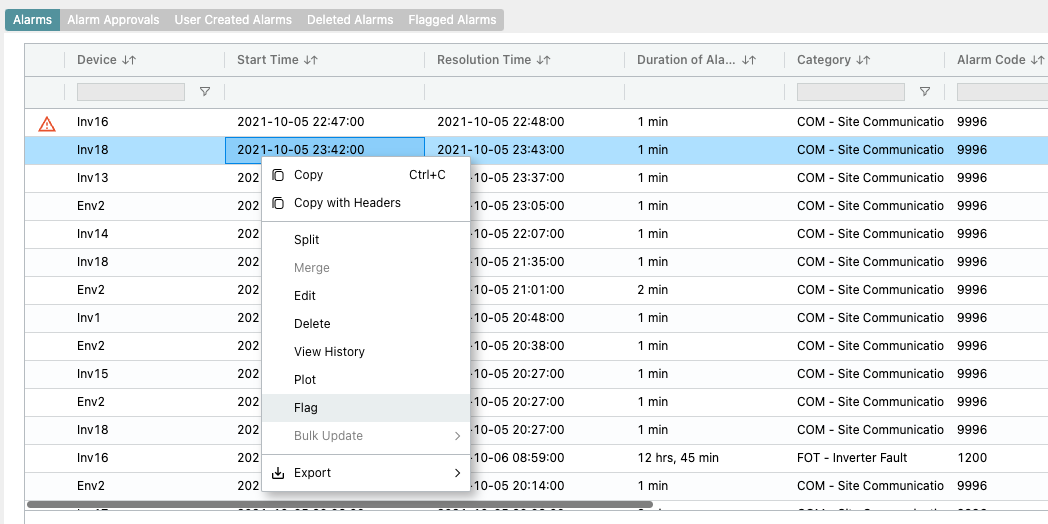
On the Flag Alarm menu, users can enter a note which should be related to the reason for flagging the alarm.
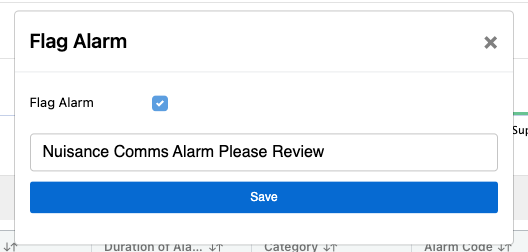
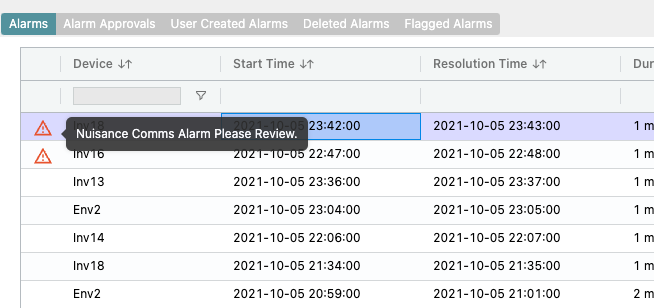
Saving this creates a Flagged Alarm icon next to the alarms that have been flagged. Hovering over this with the mouse brings up a text box with the note issued when flagging the alarm.
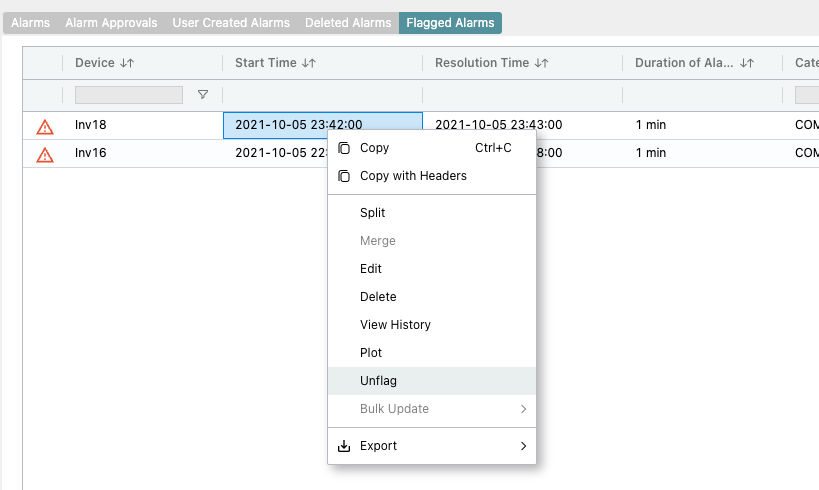
Users can also access an aggregated list of flagged alarms from the Flagged Alarms tab on the Alarms module. The reason they were flagged can be seen by hovering over the Flagged Alarm icon on the left side of the alarm.

Alarms can also be unflagged by following the same process as flagging the alarm, right clicking and selecting Unflag.
Alarm Reconciliation Process
Editing an alarm can potentially effect the availability calculation. If it does, a standard approval process is followed on the platform requiring a user with Availability Approver permissions.
In this example we would like to split an alarm as part of it is considered available and the other part is considered unavailable.
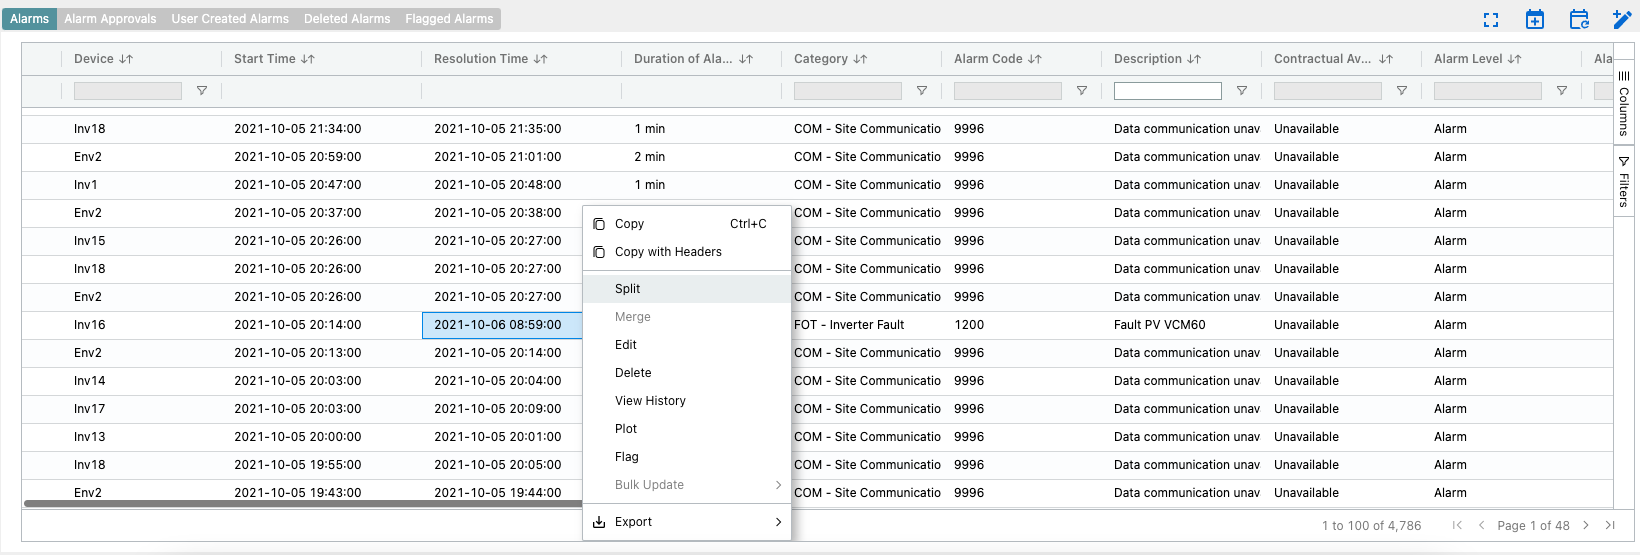
This alarm spans 2 days, but one of the days should be considered available, as it is a carve out in the availability agreement for this specific site for this alarm type. We want the alarm to split at midnight on 10/6/2021, so the split time is adjusted to be so.
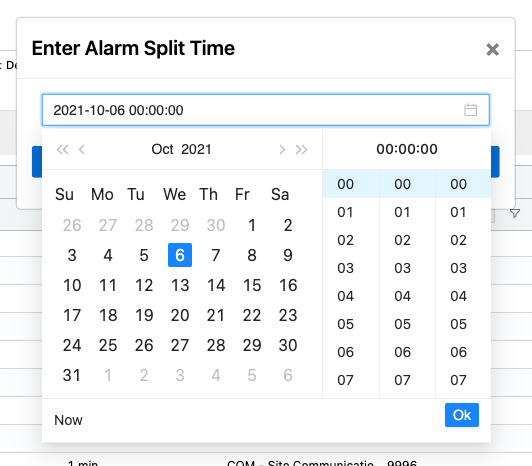
After the alarm is split, two alarms now show up for this time period.

As stated, in this example we want the day of 10/5/2021 to be marked Available. This alarm is automatically populated as Unavailable so we will switch using the user interface in the alarms table, but clicking in the cell to open the dropdown menu and select Available.

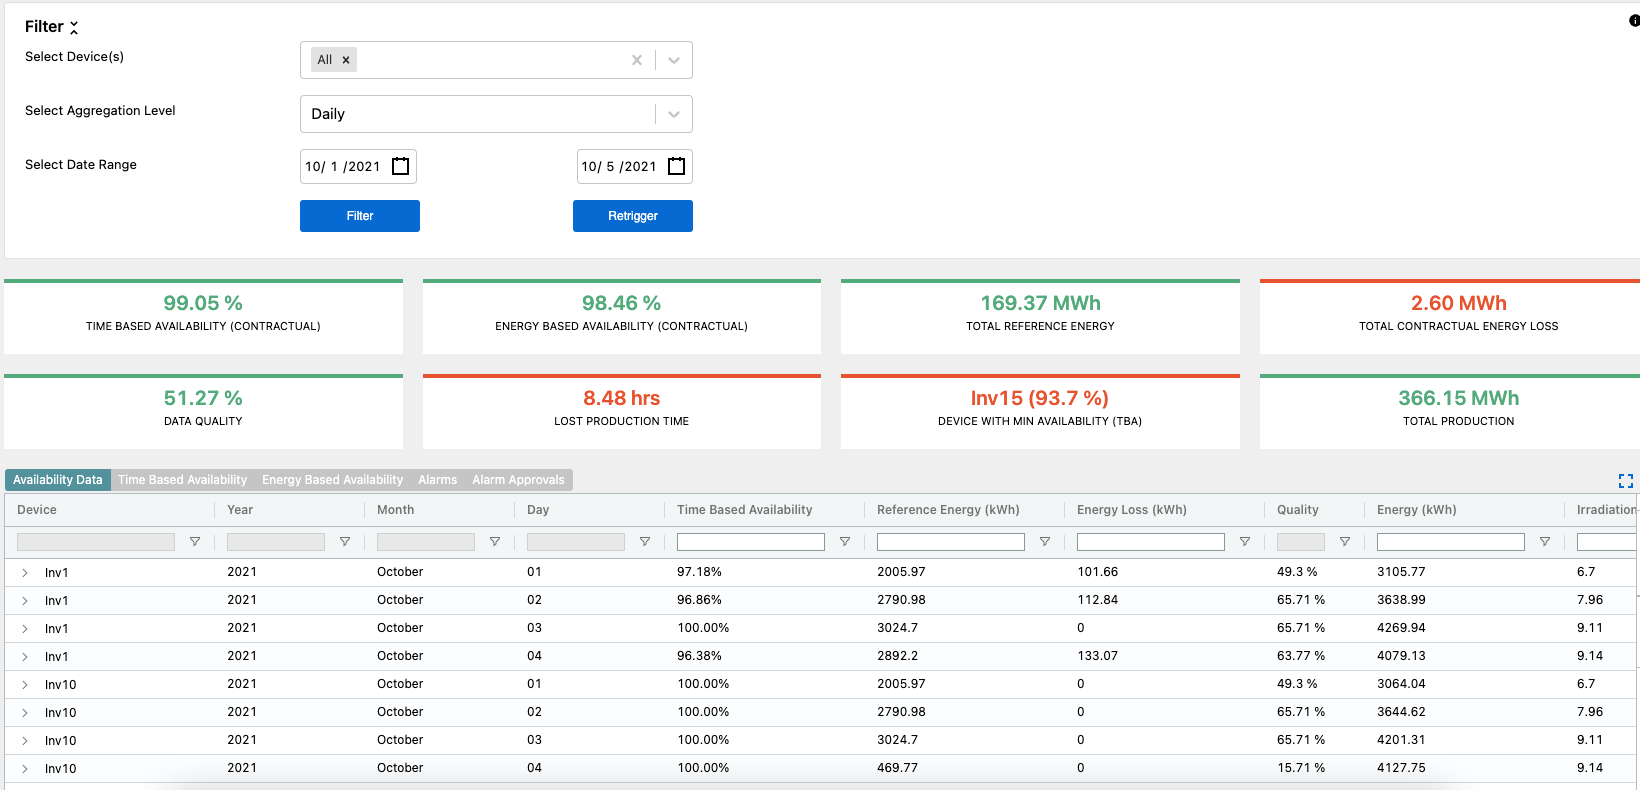
Once this has been done, it will populate under the Alarm approvals tab as this change affects the availability calculation and will need approval by a user with Availability Approver permissions.

Alarms, Warnings, Logs
As you are learning more about the alarms tab and filtering through different events, you may have come across Alarms, Warnings, and Logs. If there is an event not appearing in the Alarms table it may be helpful to include Alarms, Warnings, and Logs in your filter criteria.
Tables can't be imported directly. Please insert an image of your table which can be found here.
Event Type
Description
Alarms
Alarms are system messages that signal an error situation that has caused a unit in the wind farm to stop normal operation and go from Run state to the Pause, Stop or Emergency operational state.
Warnings
Warnings are system messages that signal an irregularity that requires attention but does not cause the turbine to stop normal operation immediately and leave Run state.
Logs
Logs are system messages that are written to the wind turbine log. They typically do not interrupt or influence the operation of the wind turbine. But some logs indicate downtimes such as Repair or Maintenance.
Raw Events Tab
Within the alarms module is the Raw Events tab. This allows for users to view the raw files that contain the alarms data for a specific asset.
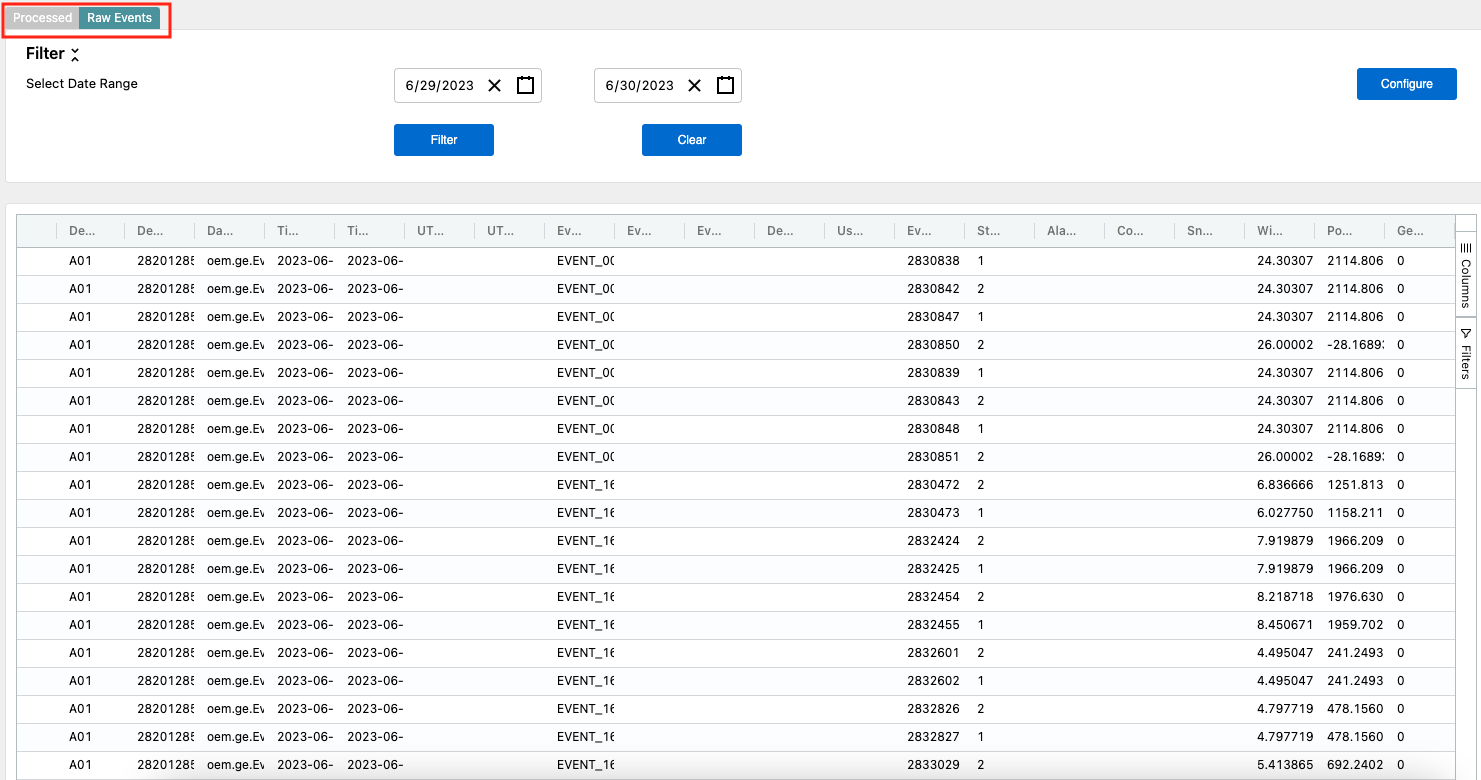
In this view, users can see the raw unprocessed data versus the standard view of the alarms data that SparkCognition has processed. Users can filter by date to view different time ranges.
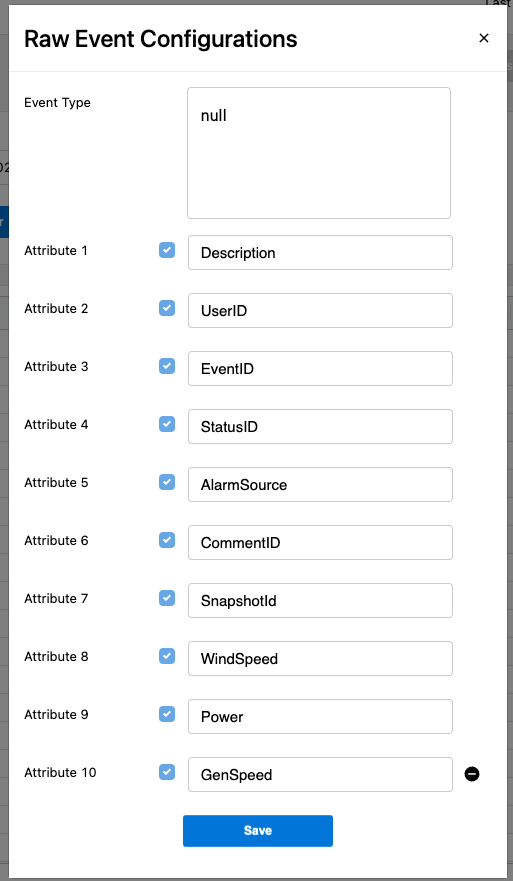
Selecting the Configure option brings up the configuration menu. This allows for users to set up the specific data columns to match the files being received by SparkCognition Renewables Suite for processing. Column names can also be updated to reflect a new naming convention if desired.
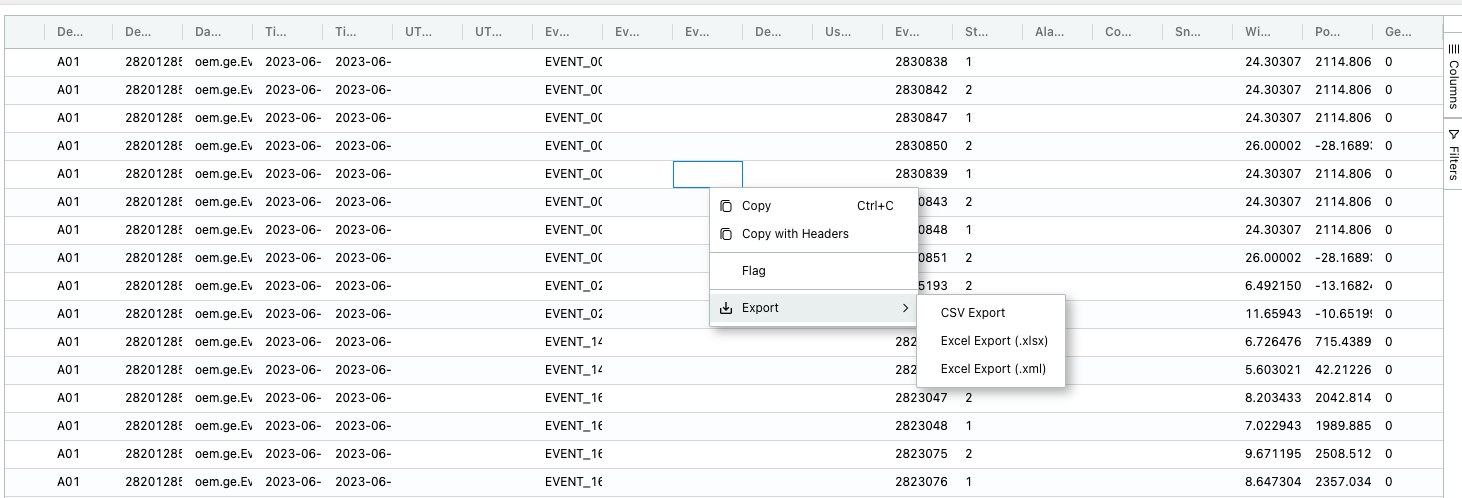
By right clicking within the table, users can chose from a variety of options, but two helpful ones are Flag and Export. The Flag functionality allows users to tag a raw alarm event for review with a note similar to the Processed Alarms module. Export allows for users to export the filtered date range raw events into a csv, xlxs, or html file.
